| Accuracy Level | Typical Effort Required | Relative Cost to Achieve |
|---|---|---|
| 90 to 95 percent | Standard vision system, rigid gripper, common SKUs | Baseline |
| 95 to 98 percent | Improved vision, basic grip-force feedback | 1.5x to 2x baseline |
| 98 to 99.5 percent | Multi-modal sensing, adaptive grippers, SKU-specific tuning | 4x to 6x baseline |
| 99.5 to 100 percent | Custom end-of-arm tooling, edge-case ML retraining, human-in-the-loop fallback | 10x+ baseline |
The Accuracy Curve Nobody Puts in the Sales Deck
Every robotic picking vendor advertises accuracy figures north of 99 percent, and most of those figures are true under the conditions the vendor tested. What rarely makes it into the pitch is the shape of the cost curve behind that number. Getting a robotic picking system from a standing start to roughly 95 to 98 percent accuracy is a comparatively well-solved engineering problem in 2026: mature vision systems, standard grippers, and well-behaved rigid SKUs get a system most of the way there without exotic effort. The last one to two percent, however, is where the economics change entirely, because that fraction is disproportionately made up of the hardest cases a warehouse handles: deformable poly bags, crushed or torn packaging, oddly shaped or fragile items, and rare SKUs the system has seen only a handful of times.
This article walks through why that final percentage point costs so much more than the ones before it, what the real accuracy numbers look like across manual and robotic picking, and how operators should think about the point of diminishing returns when deciding how much further to invest.
Where Picking Accuracy Stands Today
Modern piece-picking robots achieve mis-pick rates below 0.5 percent in well-tuned deployments, translating to accuracy above 99.5 percent, compared with manual picking accuracy that typically runs 96 to 99 percent depending on training, fatigue, and SKU complexity. Automation’s accuracy advantage over manual picking is real and well-documented, but the advantage is not evenly distributed across the difficulty spectrum of items a warehouse actually handles.
| Picking Method | Typical Accuracy Range | Consistency Across Shifts |
|---|---|---|
| Manual picking | 96 to 99 percent | Degrades with fatigue and shift length |
| Robotic picking (standard SKUs) | 99.5 percent and above | Consistent regardless of time or workload |
| Robotic picking (deformable / edge-case SKUs) | 95 to 98 percent without additional investment | Consistent but lower baseline than standard SKUs |
Why the Math Changes Above 98 Percent
At the industry scale, even a seemingly tiny error rate multiplies into a large absolute number: with millions of picks happening across warehouses every day, a 1.5 percent miss rate translates into thousands of wrong shipments annually across the industry. This is the paradox at the center of the last-percent problem — the number looks small in isolation but is large in aggregate, which is exactly why operators keep chasing it even as the cost of doing so rises steeply.
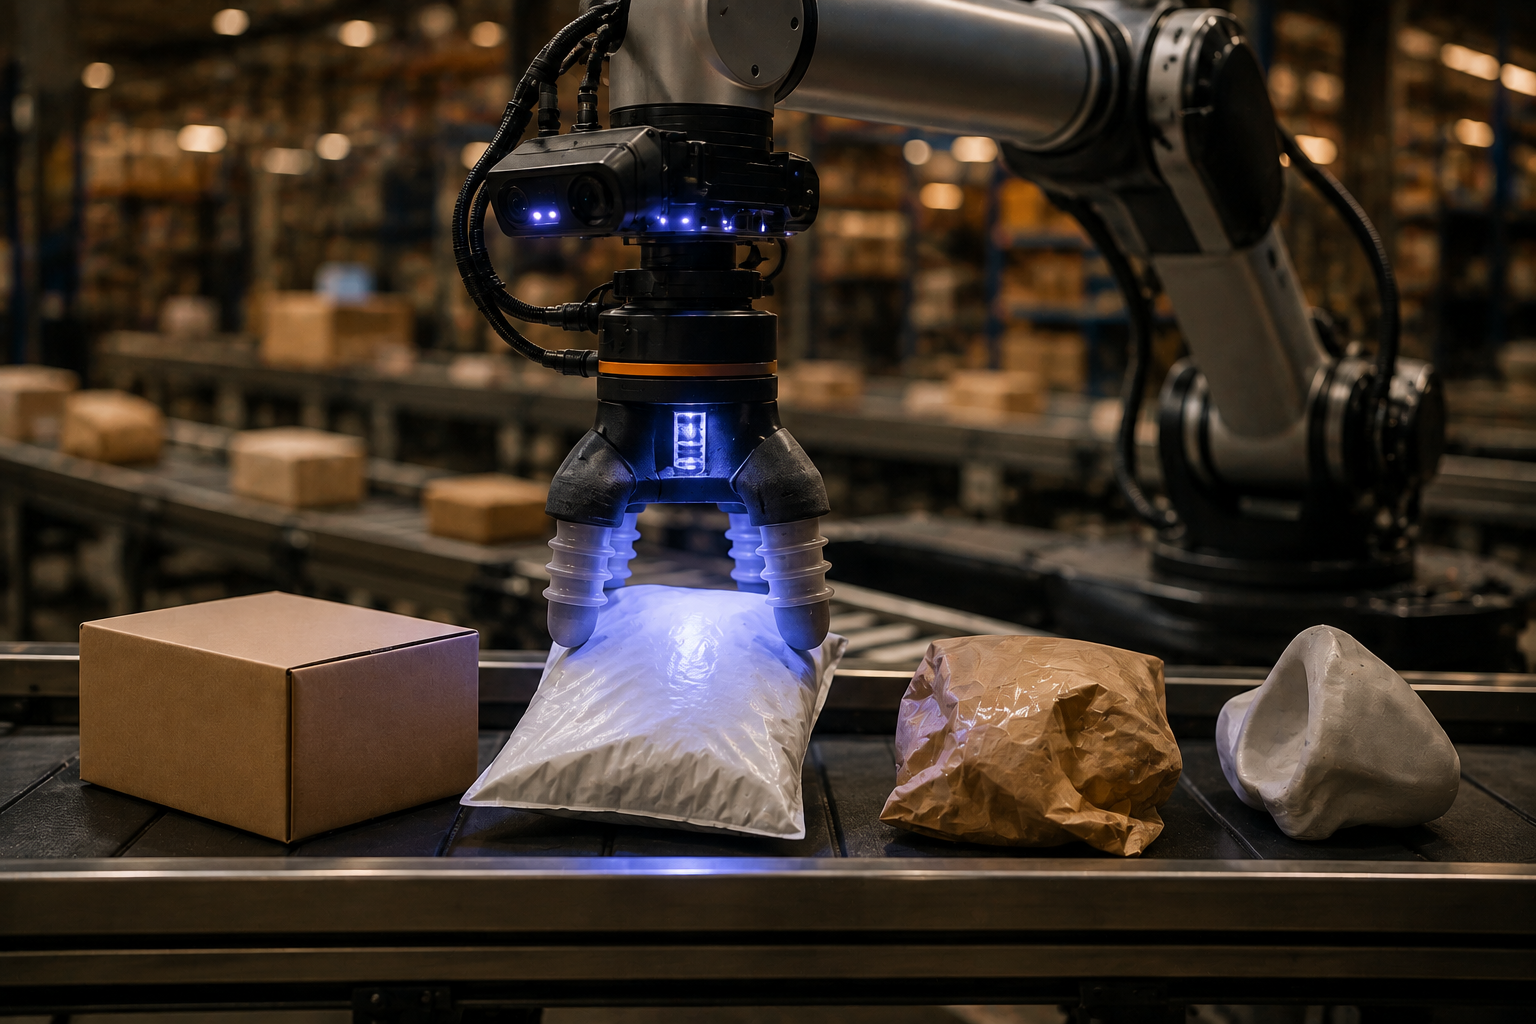
The reason the cost rises steeply is that the easy cases are, definitionally, already solved by the time a system reaches 98 percent. What remains is a long tail of low-frequency, high-difficulty cases: a poly bag that collapses unpredictably under the gripper, a box crushed in transit whose barcode is partially obscured, a fragile item that needs variable grip force calibrated in real time, or a brand-new SKU the vision model has only encountered a handful of times and has not yet learned to handle reliably.
Figure: The Diminishing Returns Curve of Picking Accuracy
A cost-versus-accuracy curve that stays relatively flat from 90 to 95 percent, rises moderately from 95 to 98 percent, and then bends sharply upward from 98 to 99.5 percent and beyond, illustrating that each additional tenth of a percentage point near the top of the curve requires disproportionately more engineering investment than the equivalent gain lower on the curve.
The Four Categories Driving the Last-Percent Cost
1. Deformable and Soft Packaging
Poly bags, shrink-wrapped items, and soft goods do not present a consistent, predictable shape to a vision system or a fixed grip point to a standard end-of-arm tool. Handling them reliably requires either a specialized soft-robotics gripper capable of adapting its grip in real time, or a vision system sophisticated enough to identify a stable grasp point on an item whose shape changes every time it is touched. Both solutions add meaningful engineering and hardware cost compared to picking a rigid box.
2. Damaged or Irregular Packaging
Warehouses inevitably receive and must pick items with damaged, torn, or crushed packaging, where the barcode may be partially obscured, the item’s shape no longer matches its expected profile, or the packaging integrity itself is compromised. A robotic system tuned for standard packaging often fails on these cases unless specifically trained on damaged-package scenarios, which requires collecting and labeling a much rarer class of training data.
3. Rare and Long-Tail SKUs
A typical fulfillment operation follows something close to a rule of thumb where the most common SKUs make up the bulk of daily picks, while a long tail of rarely-ordered items accounts for a small fraction of volume but a disproportionate share of picking errors, because the vision and grasping models have far less training exposure to these items. Achieving high accuracy on the long tail requires either continuous model retraining as new SKUs are onboarded or a fallback process for items the system has not seen enough times to trust.
4. Fragile or High-Value Items
Items that are fragile, oddly weighted, or high-value carry a higher cost of failure even when the pick itself succeeds mechanically, because a slightly-too-firm grip can damage the product itself. This requires variable force-feedback grippers and often a slower, more deliberate picking cycle for these SKUs specifically, trading a small amount of throughput for a large reduction in damage-related returns.
Common mistake
Operators frequently benchmark a robotic picking vendor’s accuracy claim using the vendor’s own test SKU set, which is typically weighted toward rigid, common items, rather than testing against their own actual long-tail and deformable-item mix, leading to a large gap between the promised and the realized accuracy rate.
What It Costs to Close the Gap
Implementation costs for robotic picking systems vary enormously depending on how much of that last percentage point a facility is trying to capture. Basic systems built around standard rigid SKUs can be deployed for roughly 250,000 dollars, while full robotic deployments engineered to handle a broad and difficult SKU mix, including deformable and irregular items, can run 5 million dollars or more. The gap between those two figures is almost entirely the cost of chasing the last one to two percent of accuracy across a difficult item mix, rather than the cost of basic pick-and-place functionality itself.
| Investment Level | Approximate Cost | What It Buys |
|---|---|---|
| Basic system | Around $250,000 | Standard rigid SKU picking, common items only |
| Mid-tier system | $500,000 to $1.5 million | Broader SKU coverage, some deformable-item handling |
| Full robotic deployment | $5 million or more | Comprehensive SKU coverage including edge cases and damaged packaging |
Robotics-as-a-Service as a Middle Path
Robotics-as-a-Service (RaaS) financing has emerged as a way to reduce the total cost of ownership for picking automation by up to 30 percent compared with an outright purchase, with AMR fleets in supporting roles reaching payback in as little as twelve months. For picking accuracy specifically, RaaS models also let operators start with a mid-tier system and add capability incrementally as the vendor’s models improve, rather than committing capital upfront to chase the last percentage point immediately. For a deeper comparison of financing structures, see our companion piece on Robotics-as-a-Service pricing models.
What worked
Facilities that segmented their SKU catalog into “standard,” “deformable,” and “long-tail” tiers before selecting a picking system — and then bought accuracy capability matched to each tier’s actual volume — consistently avoided overpaying for edge-case handling on items that made up a negligible share of daily picks.
The Volume Threshold That Justifies Chasing the Last Percent
A commonly cited rule of thumb in the industry holds that fifty or more of the same pick per shift is roughly the volume threshold at which investing further in accuracy for a specific SKU or SKU category starts to pay for itself. Below that threshold, the labor cost of a human fallback process for a small number of difficult items is often cheaper than the engineering investment required to automate them fully.
- Barcode legibilityDamaged or poorly printed barcodes cause a disproportionate share of picking errors and are often cheaper to fix at the labeling stage than at the picking stage.
- Gripper interchangeabilitySystems that can swap end-of-arm tooling automatically for different item classes handle a wider SKU mix without a full hardware redesign.
- Human-in-the-loop fallbackRouting the hardest one percent of picks to a human worker rather than forcing full automation is often the most cost-effective way to close the final accuracy gap.
- Continuous model retrainingVision and grasping models need ongoing retraining as new SKUs are introduced, not a one-time training pass at deployment.
- Return and damage costA mis-pick or damaged item costs far more than the picking labor itself once return shipping, restocking, and customer service are included.
- Seasonal SKU churnFacilities with high seasonal SKU turnover face a moving target for accuracy, since a large share of items may be new to the system every quarter.
Where Robotic Picking Accuracy Fits in the Broader ROI Picture
Picking accuracy is only one input into the overall automation return on investment, and it interacts closely with the payback timelines operators can expect at different facility sizes. Facilities weighing how much accuracy investment to make should read this alongside our companion data piece on warehouse automation ROI and payback periods by facility size, since the marginal cost of the last accuracy percentage point should be evaluated against the marginal labor savings it actually produces, not against accuracy as an abstract engineering goal.
Glossary
- Mis-pick rate
- The percentage of picks that result in the wrong item, wrong quantity, or a failed pick attempt, used as the inverse measure of picking accuracy.
- End-of-arm tooling
- The gripper or tool attached to the end of a robotic arm, engineered specifically for the shape, weight, and fragility of the items it needs to handle.
- Long-tail SKU
- A low-frequency item that makes up a small share of total order volume but, in aggregate, represents a large and difficult category for automated systems to learn.
- Human-in-the-loop
- A workflow design where a human worker handles exceptions or edge cases that an automated system is not confident enough to complete on its own.
- Grip-force feedback
- Sensor technology that lets a robotic gripper adjust the force it applies in real time based on the item’s fragility and weight.
Key Takeaways
- Robotic picking systems now exceed 99.5 percent accuracy on standard SKUs, well above the 96 to 99 percent typical of manual picking.
- The last one to two percent of accuracy is disproportionately expensive because it is concentrated in deformable items, damaged packaging, and rare long-tail SKUs.
- Implementation costs range from around $250,000 for basic systems to $5 million or more for comprehensive deployments handling difficult SKU mixes.
- A commonly cited rule of thumb is that fifty or more of the same pick per shift justifies further accuracy investment for that item category.
- Human-in-the-loop fallback for the hardest edge cases is often more cost-effective than fully automating the last percentage point.
- Robotics-as-a-Service financing can reduce total cost of ownership by up to 30 percent and allows incremental accuracy investment over time.
- Segmenting SKUs into standard, deformable, and long-tail tiers before purchasing helps avoid overpaying for edge-case handling on low-volume items.
FAQs
What is a typical robotic picking accuracy rate in 2026?
Modern robotic picking systems typically achieve accuracy above 99.5 percent on standard SKUs, with mis-pick rates below 0.5 percent in well-tuned deployments. This compares favorably to manual picking, which typically runs 96 to 99 percent depending on training and fatigue.
Why is the last percent of picking accuracy so expensive to achieve?
The last percentage point is concentrated in the hardest cases a warehouse handles: deformable packaging, damaged items, and rare long-tail SKUs. These require specialized grippers, multi-modal sensing, and continuous model retraining, all of which cost far more than handling the common, rigid, high-frequency SKUs that make up the bulk of picks.
How much does a robotic picking system cost?
Costs vary widely based on the SKU difficulty the system needs to handle, ranging from around $250,000 for basic systems handling standard rigid items to $5 million or more for comprehensive deployments that reliably handle deformable, damaged, and long-tail SKUs.
What types of items are hardest for robots to pick accurately?
Deformable and soft packaging, damaged or crushed items with obscured barcodes, fragile or oddly weighted products, and rare long-tail SKUs with limited training data are consistently the hardest categories for robotic picking systems to handle at high accuracy.
Is it worth automating the last one to two percent of picking accuracy?
It depends on volume. A common industry rule of thumb suggests that fifty or more of the same pick per shift justifies further accuracy investment for that SKU category, while lower-volume edge cases are often more cost-effective to route to a human worker as a fallback.
Does Robotics-as-a-Service help reduce picking accuracy investment costs?
Yes, RaaS financing can reduce total cost of ownership by up to 30 percent compared to outright purchase and allows operators to start with a mid-tier system, adding accuracy capability incrementally as vendor models improve rather than committing full capital upfront.
How does manual picking accuracy compare to robotic picking accuracy?
Manual picking typically achieves 96 to 99 percent accuracy and degrades with fatigue and shift length, while robotic picking on standard SKUs exceeds 99.5 percent and remains consistent regardless of time of day or workload, though robotic accuracy on deformable and edge-case items can fall closer to the manual range without additional investment.
What is human-in-the-loop fallback in robotic picking?
Human-in-the-loop fallback is a workflow where the robotic system routes picks it is not confident about, typically the hardest edge cases, to a human worker rather than attempting to fully automate every scenario. This approach is often more cost-effective than engineering the system to handle rare cases autonomously.
References
- Buske, “Automated Warehouse Picking: Systems, Technology and ROI”
- BlueSky Robotics, “Automated Warehouse Picking: How It Works and What It Costs in 2026”
- Keymas Conveyor Systems, “ROI of Robot Picking Systems vs Manual Picking: What’s the Real Cost?”
- Open Sky Group, “Warehouse Automation Statistics: 28 Stats You Should Know for 2026”
- Ednex Automation, “Automated Picking Systems for Warehouses: A Strategic 2026 Integration Guide”
- Locus Robotics, “Top Warehouse Automation Trends to Watch in 2026”
- MTLI Group, “Improve Warehouse Picking Accuracy: Proven Steps”
For related reading, see how warehouse automation ROI varies by facility size, how AMRs compare to AGVs for mobile picking support tasks, and how Robotics-as-a-Service pricing models can lower the barrier to accuracy upgrades. Facilities scaling picking operations should also review robotic micro-fulfilment in urban retail and broader trends toward fully dark warehouses.