A semantic layer is a governed translation layer that defines business metrics once, in one place, so every dashboard, spreadsheet, and AI agent that queries revenue or active users gets the exact same number. Paired with a metrics store, it replaces scattered SQL definitions with a single source of truth teams can trust and reuse.
| Milestone | Detail |
|---|---|
| 2012 | Looker introduces LookML, an early modeling language for defining reusable business logic on top of raw tables |
| 2016 | Cube.dev’s founders begin building what would become an open-source, headless semantic layer |
| February 2023 | dbt Labs acquires Transform to accelerate a rebuilt, metrics-first semantic layer |
| October 2023 | dbt Labs unveils the MetricFlow-powered dbt Semantic Layer at Coalesce 2023 |
| December 2023 | The legacy dbt Semantic Layer and dbt Metrics are officially deprecated in favor of MetricFlow |
Why Reporting Breaks Without a Semantic Layer
Ask three analysts to define “active user” and, without a shared layer, you will likely get three different SQL queries: one counts logins, one counts a specific in-app event, and one excludes internal test accounts. Every one of those queries can be individually correct and still produce three different numbers on three different dashboards. A semantic layer exists to prevent exactly this: it centralizes the definition of a metric, along with its dimensions, filters, and joins, so that every tool querying “active users” pulls from the same governed logic instead of reinventing it.
This problem compounds as organizations adopt more BI tools, spreadsheets, and now AI agents that generate their own SQL on demand. Without a semantic layer, each new consumer is another opportunity for a subtly different definition to creep in. With one, the definition lives in a single, version-controlled place, and every consumer, human or machine, queries through it rather than around it. This is precisely the fragmentation that newer product analytics and data activation platforms are designed to solve by centralizing metric access for both dashboards and downstream tools.
Semantic Layer Versus Metrics Store: What Is the Difference
The terms overlap heavily in practice, but they emphasize different parts of the same idea. A semantic layer typically refers to the full modeling layer: tables, joins, dimensions, and business logic exposed through a consistent API to any downstream tool. A metrics store is a narrower concept popularized more recently, focused specifically on defining metrics (a revenue number, a churn rate, a conversion percentage) with their calculation logic, so that the metric itself, not just the underlying tables, becomes a governed, queryable object. In practice, modern tools like dbt’s MetricFlow blend both ideas: you model the underlying entities and dimensions, then define metrics on top that any BI tool or API client can request by name.
| Concept | Primary Focus | Example Tool |
|---|---|---|
| Semantic layer | Governed models: tables, joins, dimensions, and business logic exposed via an API | Cube, LookML |
| Metrics store | Governed metric definitions (calculation, grain, time dimension) queryable by name | dbt Semantic Layer with MetricFlow |
| Traditional BI model | Logic embedded inside a single BI tool, not portable to other consumers | Legacy dashboard-specific data models |
How the Major Tools Actually Compare
dbt Semantic Layer and MetricFlow
Rebuilt from the ground up after dbt Labs acquired Transform in February 2023, the current dbt Semantic Layer runs on MetricFlow, a query-planning engine that understands joins, supports cumulative and ratio metrics, and handles slowly changing dimensions. It was formally unveiled at Coalesce 2023 in October, and the earlier, more limited dbt Metrics implementation was retired that December. Because it lives inside the dbt project alongside transformation code, metric definitions get version control, testing, and code review the same way any other analytics engineering artifact does.
Cube
Cube grew out of an open-source analytics framework its founders started building in 2016 and later repositioned explicitly as “headless BI”: a semantic layer with an API at the center, rather than a dashboard tool with modeling bolted on. It is database-agnostic by design, aiming to sit in front of a wide range of warehouses and serve a consistent metrics API to whatever front end a team chooses, from custom applications to standard BI tools.
LookML
Looker introduced LookML in 2012 as a language for defining dimensions, measures, and relationships once and reusing them across every Look and dashboard built on top. It is one of the earliest widely adopted examples of the semantic layer concept, though it remains most tightly coupled to the Looker product itself rather than being a standalone, tool-agnostic layer.
Where the Semantic Layer Sits
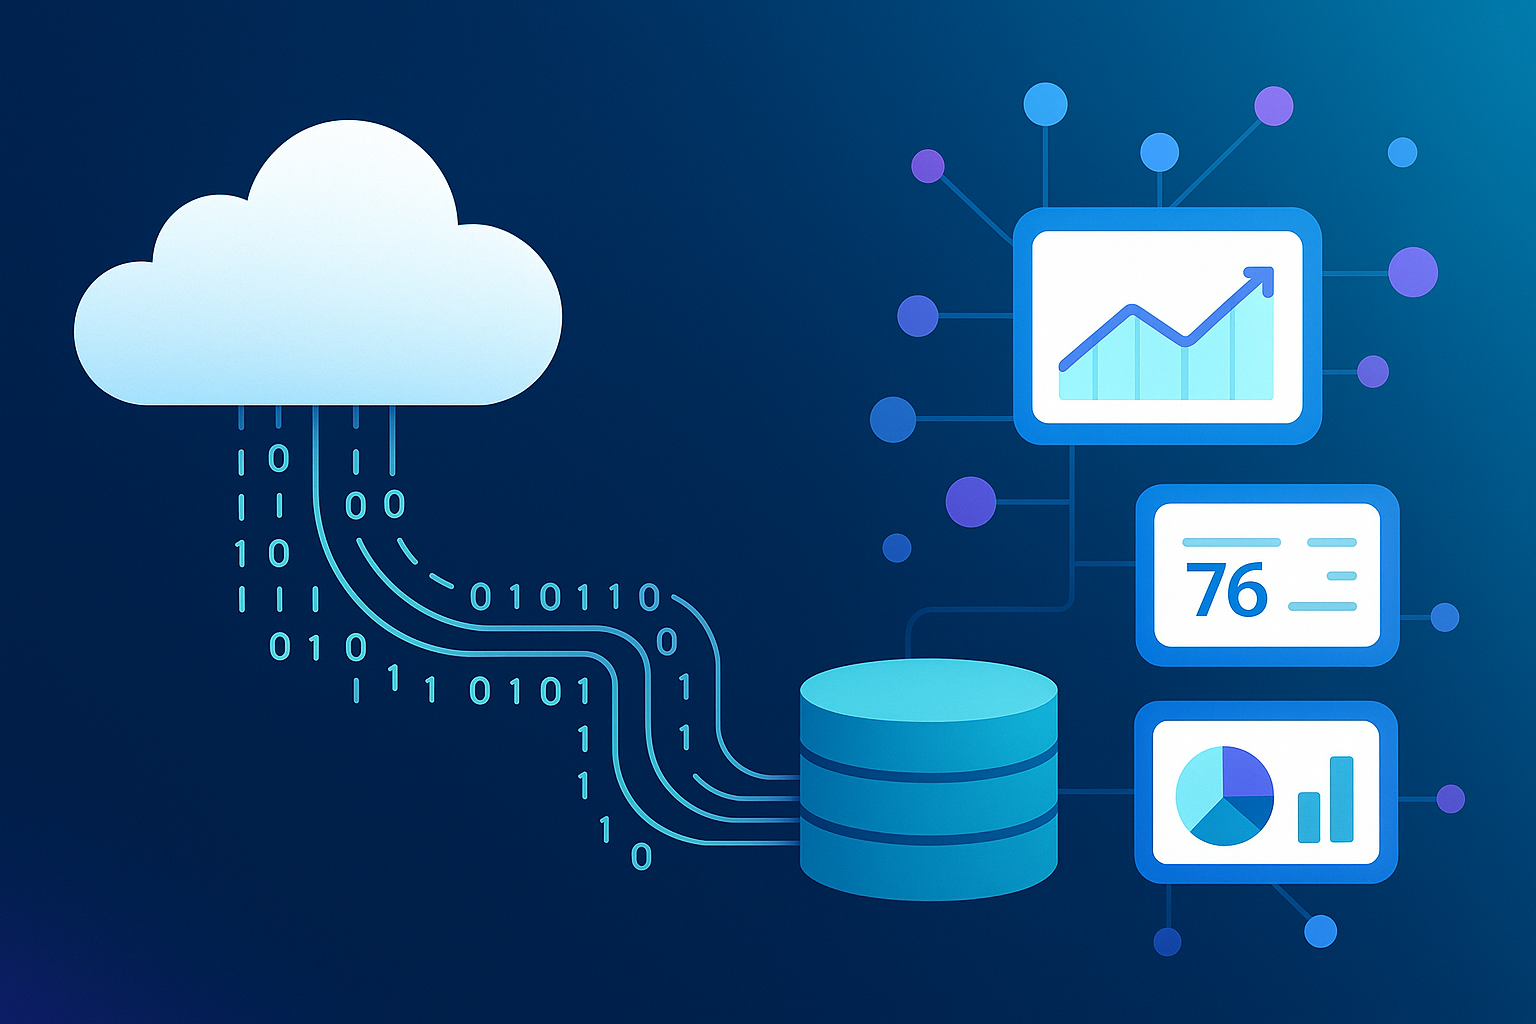
Raw and transformed tables live in the warehouse. The semantic layer sits directly on top, exposing governed metrics and dimensions through a query API. BI tools, spreadsheets, embedded analytics, and AI agents all query through that API rather than writing warehouse SQL directly, so a single metric definition update propagates to every consumer at once.
One governed layer, many consumers: the layer is the contract between data teams and everyone who queries their numbers.
Building a Metrics Store: The Practical Steps
1. Identify Your Highest-Stakes Metrics First
Start with the two or three numbers that appear in board decks or get quoted in customer conversations, such as monthly recurring revenue or active users. These are the metrics where inconsistent definitions cause the most damage and where a governed definition pays off fastest, especially as cloud software adoption keeps adding new tools that each want to query the same numbers.
2. Model Entities and Dimensions Before Metrics
MetricFlow and similar tools expect you to define the underlying semantic model, entities, dimensions, and their relationships, before layering metrics on top. Skipping this step and jumping straight to metric formulas tends to produce brittle definitions that break when a join changes.
3. Migrate Consumers Gradually
Do not force every dashboard to switch on day one. Point new dashboards and any AI-driven querying at the semantic layer first, then migrate legacy dashboards as they come up for their normal refresh cycle, similar to how teams stage any API migration behind a versioned interface.
4. Set Access and Governance Rules
Decide who can create or modify a metric definition. Uncontrolled write access to the semantic layer recreates the exact fragmentation problem the layer was built to solve, just one level up.
5. Monitor for Drift Between the Layer and Raw Queries
Even after adoption, some analysts will occasionally query the warehouse directly out of habit. Periodically reconciling ad hoc queries against the governed metric catches this drift before it produces conflicting numbers in a meeting.
The Case for Consistency, in Numbers
The financial case for shared metric definitions mirrors the broader data quality story. Gartner’s research into data quality places the average annual cost of poor data quality at 12.9 million dollars per organization, and inconsistent metric definitions are a direct contributor: every reconciliation meeting between two teams with different revenue numbers is time spent not making decisions. A semantic layer does not eliminate the need for data quality monitoring underneath it, since a governed metric built on bad source data is still wrong, but it does eliminate an entire category of disagreement about what a metric is supposed to mean in the first place.
Common Mistakes
Modeling metrics before modeling entities. Teams that skip straight to writing metric formulas without a clean underlying model end up rebuilding the same joins inside every metric definition.
Treating the semantic layer as a one-time migration. New data sources and new business questions keep arriving, so the model needs a maintenance owner, not just a launch team.
Allowing parallel definitions to persist. If the old dashboard-specific SQL keeps running alongside the new governed metric, the inconsistency the layer was meant to fix simply continues in a different place.
Ignoring performance at query time. A semantic layer that translates every request into an expensive, uncached warehouse scan will get abandoned by users the first time a dashboard feels slow.
No documentation for metric definitions. A metric without a clear description of its grain, filters, and edge cases just moves the ambiguity from SQL into an equally opaque configuration file.
How Experienced Teams Do It
Analytics engineering teams that get the most value from a semantic layer typically treat metric definitions as code: stored in version control, reviewed through pull requests, and tested the same way transformation logic is tested. They designate a small group as owners of the core business metrics, require any change to go through that review, and expose the layer through a single query API that every BI tool, notebook, and AI agent is required to use rather than querying the warehouse directly. This turns “what does the metric mean” from a recurring meeting into a one-time, documented decision.
- Semantic layer
- A governed modeling layer that exposes business definitions, dimensions, and joins through a consistent API to any downstream tool.
- Metrics store
- A system for defining business metrics, their calculation logic and grain, as queryable objects independent of any single BI tool.
- MetricFlow
- The query-planning engine that powers the current dbt Semantic Layer, supporting joins, cumulative metrics, and slowly changing dimensions.
- Headless BI
- An architecture where the modeling and metrics layer is decoupled from any single visualization front end, popularized by Cube.
- LookML
- Looker’s proprietary modeling language for defining dimensions, measures, and relationships reused across dashboards.
- Metric grain
- The level of detail, such as daily or per-customer, at which a metric is calculated and can be safely aggregated further.
Key Takeaways
- A semantic layer centralizes business logic so every dashboard, spreadsheet, and AI agent queries the same definition of a metric.
- Metrics stores narrow the focus to governed metric definitions, while semantic layers cover the broader modeling of entities and dimensions.
- dbt’s MetricFlow, Cube, and LookML represent three different architectural approaches, from analytics-engineering-native to fully headless to BI-native.
- The dbt Semantic Layer was rebuilt on MetricFlow and unveiled at Coalesce 2023, with the legacy implementation deprecated that December.
- Model entities and dimensions before writing metric formulas, or definitions become brittle and hard to maintain.
- A semantic layer does not replace data quality monitoring underneath it; a governed metric on bad source data is still wrong.
- Treat metric definitions as version-controlled code with named owners, not a one-time migration project.
FAQs
What is a semantic layer in analytics?
A semantic layer is a governed layer between raw warehouse tables and the tools that query them, defining business logic, dimensions, and metrics once so every consumer gets a consistent answer. It replaces scattered, tool-specific SQL definitions with a single API that dashboards, spreadsheets, and applications query directly.
How is a metrics store different from a semantic layer?
A metrics store focuses narrowly on governed metric definitions, such as revenue or churn, including their calculation logic and time grain. A semantic layer is the broader concept, covering entity and dimension modeling as well as the metrics built on top, and modern tools like MetricFlow combine both under one system.
Do I need dbt to use a semantic layer?
No. While the dbt Semantic Layer powered by MetricFlow is one popular option, tools like Cube offer a database-agnostic semantic layer independent of dbt, and Looker’s LookML provides similar modeling within its own platform. The right choice depends on your existing stack and how many different tools need to query the same metrics.
Why did dbt Labs rebuild its Semantic Layer?
The original dbt Metrics implementation had architectural limitations around joins and more advanced metric types. After acquiring Transform in February 2023, dbt Labs rebuilt the Semantic Layer on MetricFlow, unveiling the new version at Coalesce 2023 and deprecating the legacy implementation that December.
Can a semantic layer fix bad source data?
No. A semantic layer governs how a metric is defined and calculated, but if the underlying source data is incomplete or wrong, the governed metric will simply be a consistently wrong number instead of several inconsistent ones. Data quality monitoring on source tables remains necessary underneath any semantic layer.
How long does it take to implement a semantic layer?
Modeling the first few high-stakes metrics typically takes days to a few weeks, depending on how tangled the existing SQL logic is. Full migration of every legacy dashboard tends to take longer and is usually done gradually rather than all at once, to avoid disrupting reporting teams rely on daily.
Does a semantic layer slow down dashboard performance?
It can, if queries are not cached or the underlying warehouse is not sized appropriately, since every request is translated into a live query. Most production semantic layers include caching options specifically to keep response times acceptable for interactive dashboards.
Who should own metric definitions in a semantic layer?
A small, named group, typically analytics engineers working with finance or the relevant business stakeholders, should own core metric definitions and review any proposed change. Open write access for anyone to redefine a shared metric recreates the same fragmentation the semantic layer was built to prevent.
- dbt Developer Hub, “dbt Semantic Layer” – https://docs.getdbt.com/docs/use-dbt-semantic-layer/dbt-sl
- dbt Labs, “The New-Look dbt Semantic Layer, Powered by MetricFlow” – https://www.getdbt.com/blog/dbt-semantic-layer-whats-next
- Cube Documentation – https://cube.dev/docs
- Google Cloud Looker Documentation, “Introduction to LookML” – https://docs.cloud.google.com/looker/docs/what-is-lookml