Data quality monitoring pairs automated tests with continuous observability so bad rows, broken pipelines, and silent schema drift get caught before dashboards and machine learning models act on them. Teams combine rule-based checks, statistical anomaly detection, and freshness alerts across the pipeline, turning data trust into a measurable, repeatable engineering practice rather than a hope.
| Myth | Reality |
|---|---|
| A daily row-count check is enough to catch data problems. | Row counts miss silent issues like duplicate keys, shifted timezones, or a currency field quietly switching from cents to dollars. |
| Data quality monitoring is only a job for data engineers. | Analysts, product managers, and ML engineers all consume the same tables, so ownership of checks is usually shared across teams. |
| Once tests pass in CI, the data stays clean in production. | Source systems, vendor feeds, and upstream APIs change constantly, so production monitoring has to run continuously, not just at deploy time. |
| Buying an observability platform replaces the need for tests. | Observability tools detect anomalies you didn’t anticipate; explicit tests still encode the business rules you already know matter. |
| Data quality is a one-time cleanup project. | Quality decays continuously as schemas, vendors, and business logic evolve, so monitoring has to be an ongoing discipline. |
What Data Quality Monitoring Actually Covers
Data quality monitoring is the practice of continuously checking datasets against defined expectations and alerting a team when reality drifts from those expectations. It sits alongside automated testing, which validates transformation logic before code ships, and observability, which watches production data for anomalies nobody explicitly coded a rule for. Together they form a safety net that catches problems at three points: before code merges, right after a pipeline runs, and while data is sitting in a warehouse being queried by dashboards and models.
The discipline borrows heavily from software testing. Just as unit tests catch a broken function before it reaches production, data tests catch a broken assumption about a column before a report goes out. The difference is that data changes even when the code does not: a vendor might start sending null values in a field that was always populated, or a marketing team might quietly change a category label. Big data analytics platforms depend entirely on this kind of upstream reliability, because a model trained on subtly corrupted data produces confidently wrong answers.
The Six Dimensions Teams Actually Test
Most data quality programs organize their checks around a small set of dimensions. Each dimension answers a different question about the data, and mature teams write at least one automated test per dimension for their most business-critical tables.
| Dimension | Question It Answers | Typical Automated Check |
|---|---|---|
| Completeness | Are required fields populated? | Null-rate threshold on primary business columns |
| Uniqueness | Are records duplicated? | Primary key uniqueness assertion |
| Validity | Does data conform to expected format or range? | Regex, enum membership, or numeric range checks |
| Timeliness | Did data arrive when expected? | Freshness check against a max allowed lag |
| Consistency | Do related tables agree with each other? | Cross-table row-count or referential integrity checks |
| Accuracy | Does the data reflect real-world values? | Reconciliation against a trusted source of record |
The Data Quality Checkpoint Flow
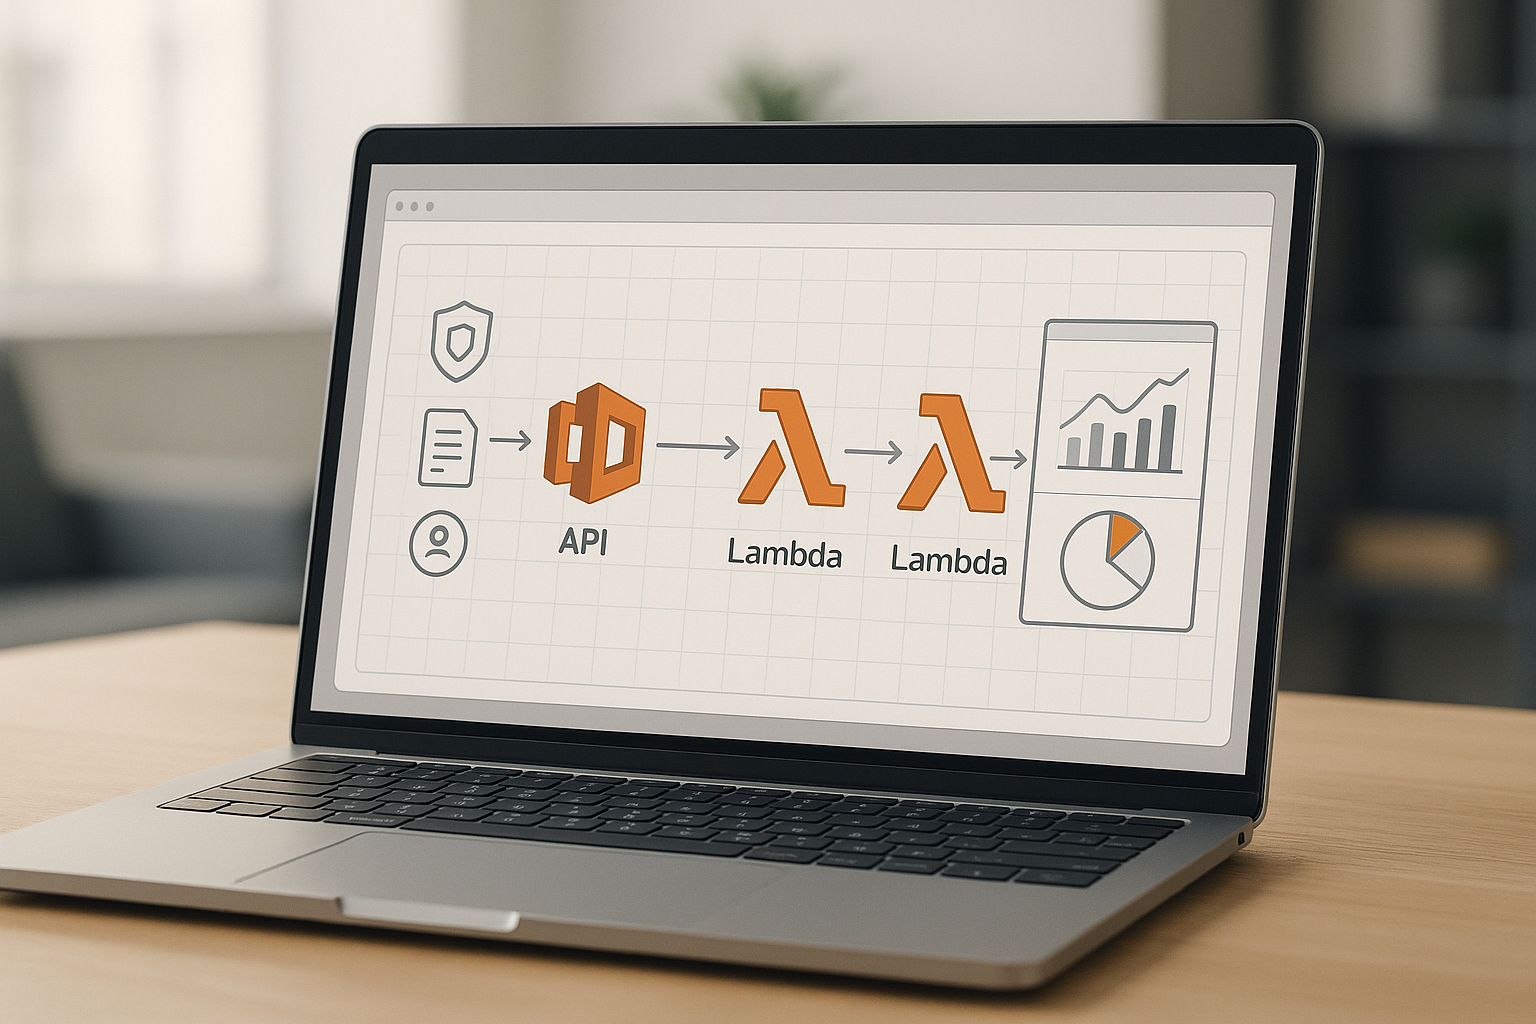
Source systems feed a staging layer, where schema and freshness checks run first. Passing rows move into transformation, where business-rule tests run (completeness, validity, uniqueness). Only rows that clear both gates reach the serving layer that dashboards and models query, and a monitoring layer keeps sampling that serving layer around the clock for anomalies the upfront tests did not anticipate.
A two-gate pattern: pre-merge tests catch known rules, continuous monitoring catches the unknown ones.
Automated Testing Frameworks: Where They Fit
Great Expectations pioneered the idea of an “expectation” as a declarative, shareable assertion about a dataset, and its documentation still serves as a reference implementation for what a mature test suite looks like. Soda takes a similar rule-based approach but centers on SodaCL, a YAML-based checks language designed to be readable by analysts, not just engineers. Both tools are strongest at codifying rules your team already knows: this column should never be null, this ID should be unique, this value should fall between zero and one hundred.
Monte Carlo popularized a different layer of the stack: data observability. Instead of relying purely on rules a human wrote in advance, it profiles historical patterns in row counts, schema, freshness, and distributions, then flags statistical deviations automatically. The company’s own framing of “data downtime” (incidents multiplied by time-to-detection and time-to-resolution) reframed data quality as an uptime problem, similar to how site reliability engineering treats service outages.
| Tool | Primary Model | Best Fit | Deployment |
|---|---|---|---|
| Great Expectations | Declarative rule-based expectations, Python-native | Teams that want testable, version-controlled data contracts in CI/CD | Open source, self-hosted or Cloud |
| Soda | SodaCL rule checks plus anomaly scoring | Teams that want analyst-readable checks alongside engineering pipelines | Open source Soda Core, or Soda Cloud SaaS |
| Monte Carlo | Automated anomaly detection and lineage-based observability | Organizations that need broad automatic coverage across many tables without hand-writing every rule | Managed SaaS platform |
Building a Monitoring Program Step by Step
1. Inventory Your Critical Tables
Start with the handful of tables that feed executive dashboards, billing, or machine learning features. Testing every table in a warehouse on day one spreads effort too thin and produces alert fatigue before anyone trusts the system.
2. Write Tests for Known Business Rules
Encode what your team already knows: a subscription status column has five valid values, an order total cannot be negative, a foreign key must exist in the parent table. These rule-based tests belong in CI, ideally run against every pull request that touches a transformation, similar to how cloud database migrations get validated before a cutover.
3. Layer On Anomaly Detection
Once rule-based tests are stable, add statistical monitoring for metrics you cannot fully specify in advance, such as expected row-count ranges or distribution shifts in a numeric column. This is where observability tools complement rather than replace explicit tests.
4. Define Ownership and Escalation
Every alert needs a named owner and a documented response path. A test that fires into a channel nobody watches is worse than no test, because it creates a false sense of coverage.
5. Track Mean Time to Detection and Resolution
Borrow reliability metrics from software engineering. If a broken pipeline takes three days to notice and two more to fix, that five-day window is exactly the kind of data downtime Monte Carlo’s model was built to quantify and reduce.
Cost of Undetected Data Issues Over Time
An issue caught in a pull request costs minutes to fix. The same issue caught after it reaches a dashboard costs hours of analyst investigation. Caught only after a business decision was made on the bad number, it costs a re-forecast, a customer apology, or a compliance review.
Detection point and remediation cost scale together: earlier gates are cheaper than later ones.
Why This Matters Financially
Gartner’s data quality research places the average annual financial impact of poor data quality at 12.9 million dollars per organization, a figure drawn from surveyed enterprises that had already invested in data quality tooling and still measured meaningful losses. Separately, a widely cited 2016 IBM-sponsored analysis estimated that poor data quality drained roughly 3.1 trillion dollars a year from the US economy through lower productivity, failed projects, and bad decisions. Neither figure is a prediction for any single company, but both make the same point: monitoring is cheaper than the alternative, and the cost of silence compounds the longer a bad table stays in production.
This is also why data quality increasingly gets discussed alongside data contracts style thinking, even when teams do not use that exact term: an explicit, tested agreement about what a table should contain is what makes monitoring possible in the first place. Without agreed expectations, there is nothing for a test to check against.
Common Mistakes
Testing only after an incident. Reactive teams add a check for the exact failure that just happened, then stop, leaving every other column unmonitored until the next surprise.
Alerting without severity levels. When a minor formatting warning and a broken revenue pipeline trigger the same notification, people learn to ignore the channel entirely.
No ownership assigned to checks. A test with no clear owner tends to get silenced or deleted the first time it is inconvenient, rather than investigated.
Testing the warehouse but not the ingestion layer. Problems caught only at the serving layer have already propagated through every transformation step, making root-cause analysis far slower.
Treating thresholds as permanent. Seasonal businesses in particular need freshness and volume thresholds that adjust, or every holiday spike trips a false alarm.
How Experienced Teams Do It
Mature data platform teams typically run a two-tier system: fast, deterministic checks execute inside the orchestration pipeline itself and can halt a run before bad data lands in a production schema, while a separate observability layer continuously profiles the tables that already made it through, watching for the anomalies nobody wrote an explicit rule for. Critically, they treat test failures as they would a failed software build: the pipeline stops, an owner is paged, and the fix is tracked the same way a production incident would be, with a lightweight postmortem when a bad table did reach a dashboard.
Choosing Between Testing-First and Observability-First
Teams with a small number of well-understood, high-stakes tables tend to get more value starting with rule-based testing frameworks like Great Expectations or Soda, because they can encode exactly the rules that matter and get immediate, explainable failures. Teams managing hundreds or thousands of tables across many producers, where nobody can realistically hand-write a rule for every column, tend to lean more heavily on observability platforms like Monte Carlo for broad automatic coverage, then add targeted tests for their highest-value tables on top. Most mature organizations end up running both, because the two approaches catch different failure modes: one enforces what you already know, the other surfaces what you did not think to check. This layered approach also pairs naturally with a cloud-based data stack, where ingestion, transformation, and serving each need their own monitoring boundary.
- Data contract
- An explicit, versioned agreement between a data producer and consumer about a table’s schema, semantics, and quality guarantees.
- Data downtime
- A term popularized by Monte Carlo for the period during which data is missing, wrong, or otherwise unreliable, calculated as incidents multiplied by detection and resolution time.
- Expectation
- Great Expectations’ term for a declarative, testable assertion about a dataset, such as a column’s values falling within a defined set.
- Freshness check
- A test that verifies data arrived within an acceptable time window after it was expected.
- Observability platform
- A monitoring system that automatically profiles data patterns and flags statistical anomalies without requiring a hand-written rule for every scenario.
- SodaCL
- Soda’s YAML-based checks language for defining data quality tests in a format readable by both engineers and analysts.
Key Takeaways
- Data quality monitoring combines rule-based automated tests with continuous observability, because each catches failure modes the other misses.
- The six core dimensions – completeness, uniqueness, validity, timeliness, consistency, and accuracy – give teams a starting checklist for any critical table.
- Great Expectations and Soda excel at codifying known business rules; Monte Carlo excels at surfacing anomalies nobody anticipated.
- Gartner estimates the average annual cost of poor data quality at 12.9 million dollars per organization, making prevention consistently cheaper than cleanup.
- Tests should run in two places: pre-merge in CI against transformation logic, and continuously against production data already in the warehouse.
- Every alert needs a named owner and an escalation path, or the monitoring program quietly degrades into noise.
- Mature teams track mean time to detection and resolution for data incidents the same way software teams track uptime.
FAQs
What is the difference between data quality monitoring and data testing?
Data testing typically runs at build time, validating transformation logic before it ships, similar to unit tests in software. Data quality monitoring runs continuously against production data, watching for drift, anomalies, and freshness problems that only appear after deployment, so the two practices complement rather than replace each other.
Do I need Great Expectations, Soda, and Monte Carlo all at once?
No. Most teams start with one rule-based framework, such as Great Expectations or Soda, to encode known business rules, then add an observability layer like Monte Carlo once they have enough tables that hand-writing every rule becomes impractical. Start small and expand coverage as the warehouse grows.
How many tables should I monitor first?
Start with the tables that feed financial reporting, executive dashboards, or machine learning features, typically a handful of tables rather than the entire warehouse. Expanding coverage gradually avoids alert fatigue and lets the team build trust in the monitoring system before scaling it.
Can small teams afford a data quality program?
Yes. Open-source tools like Great Expectations and Soda Core carry no licensing cost, and a handful of well-chosen tests on critical tables provide most of the risk reduction. Observability platforms with per-table pricing can be added later as the warehouse and budget grow.
What is a good first metric to track for data quality?
Freshness and null-rate on your most business-critical table are usually the fastest wins, since both are simple to compute, hard to argue with, and catch a large share of real incidents. From there, expand into uniqueness and referential integrity checks.
How does data quality monitoring relate to data contracts?
A data contract defines what a table is supposed to look like; monitoring is how you verify the table still matches that definition over time. Without an explicit contract, monitoring thresholds tend to be arbitrary, because there is no agreed baseline to test against.
Does automated testing slow down data pipeline deployments?
Well-scoped tests add seconds to minutes to a pipeline run, far less time than the hours typically spent investigating a bad number after it reaches a dashboard. Teams that find tests slowing deployments too much usually have tests that are too broad or duplicated rather than a problem with testing itself.
What happens when a test fails in production?
In a mature setup, a failing test halts the pipeline before bad data reaches downstream tables, alerts a named owner, and gets tracked like any other production incident. The goal is for the failure to be visible and actionable within minutes, not discovered days later by a confused analyst.
- Great Expectations Documentation – https://docs.greatexpectations.io/
- Soda Data Quality Documentation – https://docs.soda.io/
- Monte Carlo, “What Is Data Observability?” – https://www.montecarlodata.com/blog-what-is-data-observability/
- Gartner, “Data Quality: Why It Matters and How to Achieve It” – https://www.gartner.com/en/data-analytics/topics/data-quality