| Myth | Reality |
|---|---|
| Automation only pays off for the biggest warehouses. | Small facilities (10,000 to 30,000 sq ft) using AMRs often see the fastest payback of any facility size, in as little as 10 to 16 months. |
| A shorter payback period always means a better investment. | Mega-facilities with 3 to 6 year payback periods often deliver $2 million to $10 million or more in annual savings once fully ramped, dwarfing the absolute return of smaller deployments. |
| ROI calculations only need to include equipment cost. | Network infrastructure upgrades alone can run $30,000 to $150,000 per facility and are routinely left out of vendor quotes. |
| All automation types have similar payback timelines. | AMRs, goods-to-person systems, and AS/RS have dramatically different capital intensity and payback curves. |
Why Facility Size Changes the ROI Equation
Every warehouse automation vendor has a favorite statistic about payback periods, and most of them are technically true and practically misleading, because the number that matters depends enormously on facility size, order volume, labor cost in the region, and the specific automation technology chosen. A 15,000 square foot regional 3PL facility and a 500,000 square foot mega-fulfillment center are not the same investment decision wearing different clothes — they sit on opposite ends of a capital-intensity spectrum, and the payback math for one tells you almost nothing about the other.
This article breaks down real payback data across three facility tiers — small, mid-size, and mega — and explains the capex, labor savings, and hidden costs that drive the difference, so that operators can benchmark their own numbers against a size-appropriate reference point rather than a generic industry average.
The Three Facility Tiers
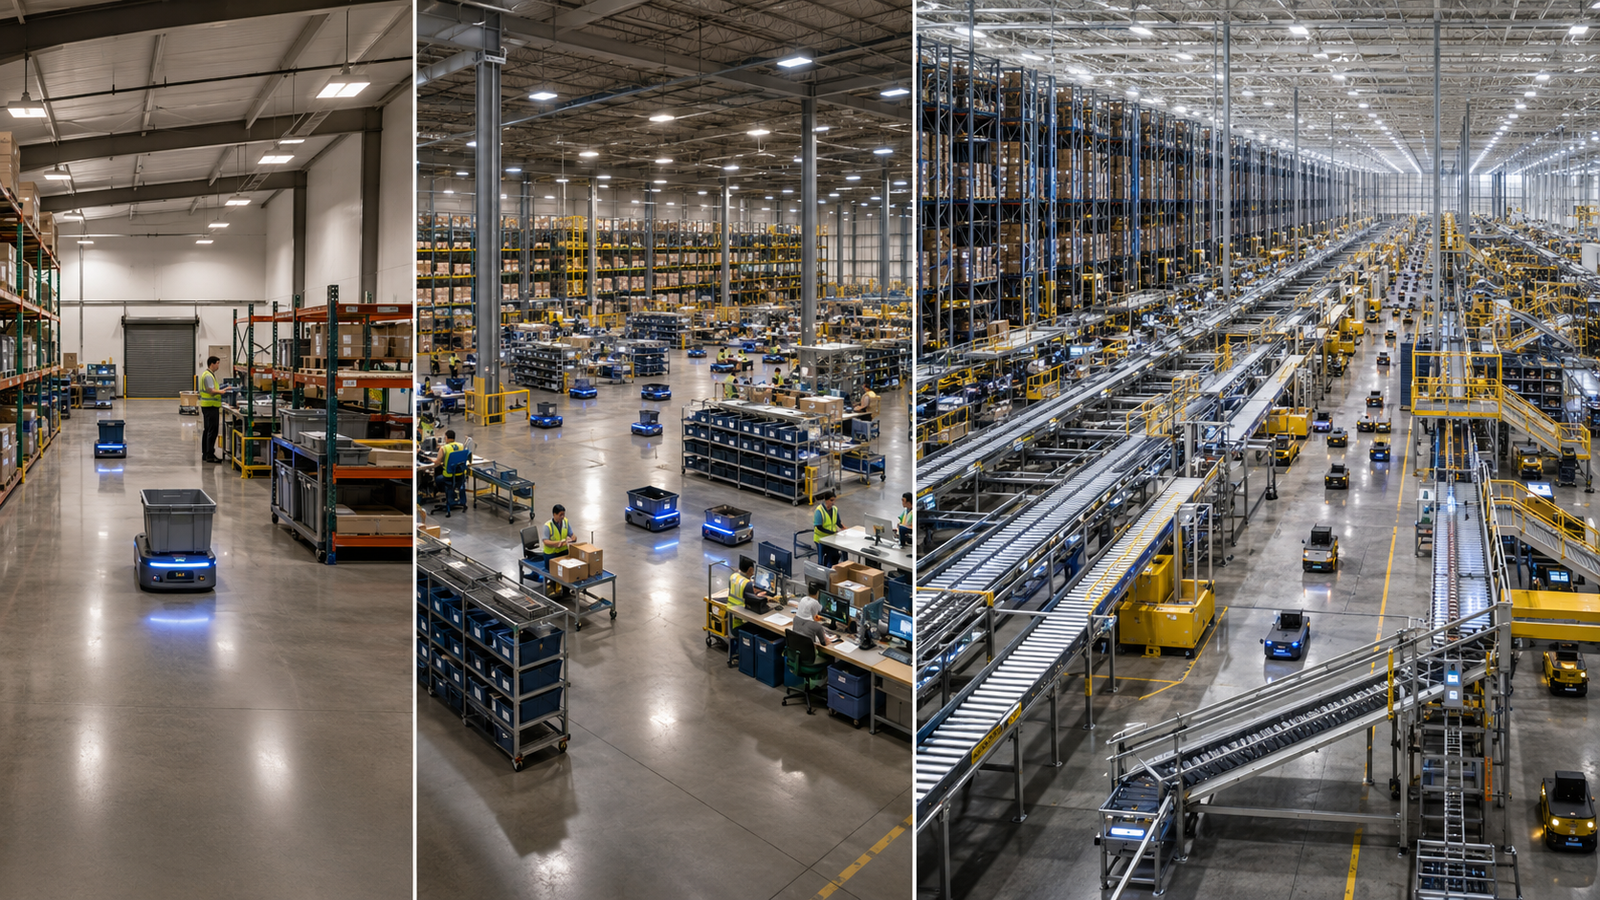
For the purposes of this analysis, warehouse facilities fall roughly into three tiers based on square footage and complexity of automation typically deployed at that scale.
| Tier | Typical Size | Common Automation | Typical Payback |
|---|---|---|---|
| Small 3PL / regional | 10,000 to 30,000 sq ft | AMR fleets, light conveyor | 10 to 16 months |
| Mid-size regional DC | 50,000 to 150,000 sq ft | Goods-to-person, mixed AMR/AGV | 2 to 3 years |
| Mega-fulfillment center | 200,000+ sq ft | AS/RS, full automation, robotic sortation | 3 to 6 years |
Small Facilities: The Fastest Payback, Smallest Absolute Return
Small 3PL and regional warehouses in the 10,000 to 30,000 square foot range have become the fastest-growing segment of automation adoption in the past two years, largely because AMR-based solutions have dropped to $15 to $30 per square foot in deployment cost and no longer require the massive capital outlay that automation used to demand. These facilities typically deploy a handful of AMRs to handle picking, transport, or replenishment tasks that would otherwise require additional headcount.
Because the capital outlay is comparatively small and labor savings kick in almost immediately — often within the first month of go-live once workers are retrained onto exception handling rather than walking pick paths — payback periods of 10 to 16 months are common. AMR fleets in live deployments have been reported to reach over 250 percent ROI where infrastructure fully supports them, though this figure assumes the facility had the network and floor conditions needed for smooth operation from day one.
Common mistake
Small facility operators frequently underestimate the ramp-up period needed to retrain staff around exception handling and robot supervision, treating the payback clock as starting on the installation date rather than the date full productivity is reached, which can overstate ROI by several months.
Mid-Size Regional Distribution Centers: The Sweet Spot for Goods-to-Person
Facilities in the 50,000 to 150,000 square foot range represent what many industry analysts consider the sweet spot for goods-to-person automation systems, where inventory is brought to a stationary picker rather than having the picker walk to inventory. These systems require more capital investment than a simple AMR fleet — typically involving racking retrofits, conveyor integration, and picking workstation buildouts — and the payback window stretches to 2 to 3 years as a result.
The labor savings at this scale are substantial because goods-to-person systems can reduce walking time to near zero and significantly increase picks-per-hour per worker, but the capital outlay for shelving, lifts, and integration software means the payback curve is longer than a pure AMR deployment. Average ROI across automation implementations at this scale is estimated at around 20 percent within the first two years for early adopters who executed the deployment well.
Figure: Payback Curve Shape by Facility Tier
Small facilities show a steep, early payback curve that flattens quickly once labor savings are captured. Mid-size facilities show a more gradual, linear curve as goods-to-person systems ramp up utilization over the first 18 to 24 months. Mega-facilities show a long, flat initial curve during construction and commissioning, followed by a steep acceleration once full automation reaches designed throughput.
Mega-Fulfillment Centers: Longest Payback, Largest Absolute Savings
Facilities above 200,000 square feet that deploy dense Automated Storage and Retrieval Systems (AS/RS) sit at the far end of the capital-intensity spectrum, with deployment costs running $80 to $200 per square foot for AS/RS and $150 to $400 per square foot for fully automated mega-facilities that integrate robotic sortation, conveyor networks, and high-density storage. These are multi-year construction and commissioning projects, not equipment purchases, and payback periods of three to six years are typical — longer for the largest, most complex builds.
What justifies this timeline is scale: annual savings of $2 million to $10 million or more once a mega-facility reaches full ramp are common, because labor reduction, space density gains, and throughput improvements compound across an enormous operational footprint. A facility of this size that saves even a modest percentage on labor cost per unit shipped can represent a far larger absolute dollar figure than a small facility’s entire annual labor budget.
| Cost Component | Small (10K-30K sq ft) | Mid (50K-150K sq ft) | Mega (200K+ sq ft) |
|---|---|---|---|
| Deployment cost per sq ft | $15 to $30 | $40 to $100 (goods-to-person) | $80 to $400 (AS/RS to full automation) |
| Typical automation type | AMR fleet | Goods-to-person, mixed fleets | AS/RS, robotic sortation |
| Payback period | 10 to 16 months | 2 to 3 years | 3 to 6 years |
| Annual savings at scale | Tens of thousands to low hundreds of thousands | Hundreds of thousands to low millions | $2M to $10M+ |
The Hidden Cost Nobody Quotes: Network Infrastructure
One of the most consistent gaps in vendor ROI calculations across all three facility tiers is network infrastructure. Automated systems, particularly AMR and AS/RS fleets, depend on robust and redundant wireless or wired network coverage throughout the facility, and upgrading a legacy warehouse’s network to support this reliably costs $30,000 to $150,000 per facility — a cost that is rarely included in the initial automation vendor quote because it falls outside the vendor’s scope of work.
Operators who fail to budget for this separately often discover the gap mid-project, when the automation system underperforms because of dropped connections or coverage dead zones, and the resulting delay pushes the payback timeline out further than originally modeled.
What worked
Facilities that commissioned an independent network site survey before signing an automation contract — rather than relying on the automation vendor’s own network assessment — consistently identified coverage gaps early enough to fix them without delaying the go-live date.
Labor Savings: The Core Driver of Payback Speed
Across all three tiers, labor savings remain the single largest contributor to payback speed, but the mechanism differs by facility type. In small facilities, savings come primarily from reducing the headcount needed for repetitive transport and replenishment tasks. In mid-size facilities, savings come from increased picks-per-hour per worker as walking time is eliminated. In mega-facilities, savings come from a combination of headcount reduction, space density (fitting more inventory into the same footprint through high-density AS/RS), and throughput gains that let the facility handle more volume without proportional labor growth.
Facilities considering automation should also factor in overall market context: the average ROI for automation implementations is estimated at roughly 20 percent within the first two years for early adopters, though this average masks wide variance driven by facility size, deployment quality, and how quickly staff adapt to working alongside automated systems — a transition that also has real safety and workflow implications covered in guidance on human-machine collaboration safety standards.
Financing Models Change the Payback Math
Robotics-as-a-Service (RaaS) subscription models have become a meaningful factor in payback calculations, particularly for small and mid-size facilities that want automation benefits without the full capital outlay. Under a RaaS model, the “payback period” concept shifts from capital recovery to a simpler operating-margin comparison: does the monthly subscription cost less than the labor and efficiency gains it produces? For a deeper breakdown of how these financing structures compare to outright purchase, see our dedicated piece on Robotics-as-a-Service pricing models.
- Ramp-up periodThe weeks or months between go-live and full productivity are often excluded from payback calculations, understating the true time to breakeven.
- Peak season capacityFacilities that size automation for average volume rather than peak volume often see slower payback because the system is underutilized outside of peak periods.
- Maintenance contractsOngoing maintenance and software licensing costs are recurring expenses that reduce net savings but are frequently modeled as one-time costs.
- Labor market volatilityRegions with rapidly rising minimum wage or labor shortages see faster payback than the same automation deployed in a lower-wage, lower-turnover labor market.
- Retrofit versus greenfieldAutomating an existing facility typically costs more and takes longer than designing automation into a new building from the start, due to retrofit constraints on floor layout and ceiling height.
- Software integration depthFacilities that integrate automation tightly with their WMS see faster payback than those running automation as a semi-isolated system requiring manual reconciliation.
Building a Realistic ROI Model
Operators building their own ROI model should include, at minimum: equipment and installation capex, network infrastructure upgrade cost, software licensing (often annual, sometimes per-robot), maintenance contracts, staff retraining cost, and a realistic ramp-up period before full productivity is assumed. On the savings side, the model should include direct labor reduction, reduced error and rework cost, throughput gains that allow revenue growth without proportional headcount growth, and any space-density savings from denser storage.
Facilities retrofitting older buildings for automation face additional cost and timeline considerations that are worth reviewing separately, since older facilities often need structural and electrical upgrades before automation vendors will even quote a project; see our companion analysis on retrofitting legacy factories for robotics for a breakdown of those retrofit-specific costs.
Glossary
- Payback period
- The amount of time required for the cumulative savings from an investment to equal the initial capital outlay.
- AS/RS
- Automated Storage and Retrieval System; a high-density storage technology using automated cranes or shuttles to store and retrieve inventory without manual handling.
- Goods-to-person
- A picking method where inventory is automatically delivered to a stationary worker, eliminating walking time between picks.
- Capex
- Capital expenditure; the upfront investment required to purchase and install equipment, as distinct from ongoing operating expenses.
- Ramp-up period
- The time between a system going live and reaching its designed productivity level, during which savings are typically below the modeled steady-state rate.
Key Takeaways
- Payback periods scale with facility size: 10 to 16 months for small AMR deployments, 2 to 3 years for mid-size goods-to-person systems, and 3 to 6 years for mega-facility AS/RS.
- Longer payback periods at mega-facilities are offset by much larger absolute annual savings, often $2 million to $10 million or more.
- Network infrastructure upgrades of $30,000 to $150,000 per facility are commonly excluded from vendor quotes and should be budgeted separately.
- Labor savings remain the core driver of payback speed across all facility sizes, though the mechanism differs by automation type.
- RaaS financing models shift the ROI question from capital recovery to a simpler monthly cost-versus-savings comparison.
- Realistic ROI models must include ramp-up time, maintenance contracts, and software licensing, not just equipment capex.
- Independent network site surveys before contract signing help avoid mid-project delays that extend payback timelines.
FAQs
What is the average payback period for warehouse automation?
The average payback period varies significantly by facility size, ranging from 10 to 16 months for small AMR deployments to 3 to 6 years for mega-fulfillment centers with full AS/RS automation. Mid-size distribution centers with goods-to-person systems typically fall in between, at 2 to 3 years.
Do small warehouses see faster ROI than large ones?
Yes, small facilities typically see the fastest payback in percentage terms, often 10 to 16 months, because AMR deployment costs are lower and labor savings begin almost immediately. However, large facilities generate far greater absolute dollar savings once fully ramped, despite a longer payback period.
What costs are commonly left out of warehouse automation ROI calculations?
Network infrastructure upgrades, ranging from $30,000 to $150,000 per facility, are the most commonly omitted cost. Ramp-up time before full productivity, ongoing software licensing, and maintenance contracts are also frequently underestimated in vendor-provided ROI models.
How much does an AS/RS system cost per square foot?
Dense Automated Storage and Retrieval Systems typically cost $80 to $200 per square foot to deploy, while fully automated mega-facilities integrating AS/RS with robotic sortation and conveyor networks can run $150 to $400 per square foot depending on complexity.
Does Robotics-as-a-Service change the payback calculation?
Yes, RaaS subscription models shift the analysis from capital payback to an ongoing cost-versus-savings comparison, since there is no large upfront capital outlay to recover. This makes automation accessible to facilities that could not justify the capex of an outright purchase.
What is the biggest driver of warehouse automation ROI?
Labor savings are consistently the largest driver of ROI across all facility sizes, though the specific mechanism varies: headcount reduction in small facilities, increased picks-per-hour in mid-size facilities, and a combination of headcount, space density, and throughput gains in mega-facilities.
How long is the ramp-up period before automation reaches full productivity?
Ramp-up periods vary by system complexity, typically spanning a few weeks for simple AMR deployments to several months for goods-to-person or AS/RS systems that require staff retraining and software integration. Excluding this period from payback models tends to overstate ROI.
Is warehouse automation worth it for a mega-fulfillment center despite a 3 to 6 year payback?
Yes, for most mega-facilities the longer payback is offset by very large absolute annual savings, often $2 million to $10 million or more once the system reaches full ramp, making the investment worthwhile despite the extended timeline compared to smaller deployments.
References
- Robotomated, “Warehouse Automation ROI by Facility Size: From 10K to 500K+ Sq Ft”
- CXTMS, “Warehouse Automation ROI Calculator: The Real Numbers Behind Picking, Packing, and Payback Periods”
- Armstrong, “Warehouse Automation ROI Guide: Payback and Financials”
- Onward Robotics, “Warehouse Automation ROI: How to Calculate Real Financial Impact”
- SellersCommerce, “Warehouse Automation Statistics (2026)”
- The Network Installers, “50+ Warehouse Automation Statistics, Market Size and ROI Data (2026)”
For related reading, see how AMRs compare to AGVs when choosing the right mobile robot for a given facility size, how robotic picking accuracy affects overall ROI, and how Robotics-as-a-Service pricing models can lower the capital barrier to entry. Facilities weighing infrastructure upgrades should also review retrofitting legacy factories for robotics and broader trends in smart warehouse infrastructure.