If you collect, research, or build around non-fungible tokens, NFT curation and analytics tools help you separate signal from noise. In plain terms, these are platforms and methods that turn raw on-chain activity and marketplace data into clear, comparable insights so you can discover worthwhile collections, avoid wash trading, and track real demand. Here’s the short answer: combine a marketplace ranking feed with a custom on-chain dashboard, add wallet-label insights, layer in rarity analysis, set proactive alerts, and always verify provenance at the contract level. This guide is educational and informational only; nothing here is financial advice—do your own research and consult qualified professionals where appropriate.
Quick start (skimmable):
- Define your core signals: volume velocity, unique buyers, holder churn, floor depth.
- Pick one dashboard platform for custom queries and charts.
- Add a wallet-label tool to follow “smart money” flows.
- Use rarity and metadata tools to validate collection design and scarcity.
- Set alerts for floor moves, whale buys, and new mints; verify everything on a block explorer.
1. Marketplace Rankings & Discovery Feeds
Marketplace ranking pages and discovery feeds give you the fastest “what’s moving now” view, but value comes from how you read the numbers—not just glancing at top volume. Start by comparing total volume to unique buyers and average sale price; genuine trends typically show volume increasing alongside breadth (more buyers), not just a few outsized transactions. OpenSea’s API and documentation outline programmatic access to collection, event, and listing data, which you can use to reconstruct rankings with your own filters. DappRadar publishes how it tracks dapps and NFTs across many blockchains, offering multiple rankings that reflect sales, traders, and volumes; pairing such feeds with your own definitions helps you tune for your niche rather than blindly following headlines. The goal is a curated shortlist you can carry into deeper analysis rather than a final verdict.
Why it matters
Ranking feeds are your top-of-funnel discovery layer. They surface candidates quickly, but raw positions can be distorted by wash trades, thin floors, or listing spam. Viewed correctly, they are a triage tool, not a finish line.
How to use it
- Pull the top 50–100 collections by volume, then sort again by unique buyers to reward breadth.
- Create a “breakout” filter: collections with ≥30% day-over-day volume growth and ≥10% more unique buyers.
- Flag outliers where the average sale price jumps while sales count drops—often a single high-ticket sale.
Numbers & guardrails
- Breadth ratio: unique buyers ÷ total sales. A ratio between 0.35 and 0.60 is typical for active sets; <0.20 can indicate a few wallets looping trades.
- Floor depth check: count listings within ±10% of floor; shallow depth (<20 items) means floors can swing on a few buys.
- Confluence rule: require at least 3 confirming signals (breadth ↑, holders ↑, listings ↓) before shortlisting.
Synthesis: Use rankings to nominate, not anoint. When volume, breadth, and floor depth align, you’ve identified a trend worth deeper, on-chain validation.
2. Custom On-Chain Dashboards (Dune & SQL-style Querying)
Community analytics platforms let you query public blockchain data directly and build dashboards that answer your questions rather than a generic “top list.” Dune provides a web app where you can create SQL queries against curated blockchain tables, then assemble widgets into dashboards for sharing or private use. Beyond canned metrics, you can compute specialized signals—e.g., first-time buyer share, mint-to-secondary conversion, or time-to-resale per collection—and visualize them in one place. Crucially, dashboards become living documents for your curation practice: as your understanding improves, you update the queries and keep your signal definition consistent across weeks. The platform’s docs cover dashboards, visualization widgets, and the general model of querying indexed on-chain data for NFTs and DeFi alike.
How to do it
- Start with a base table of NFT transfers; group by collection address, buyer, and day.
- Compute first-time buyers (wallets with no prior trade history) to gauge new demand.
- Add a holder retention query: share of wallets still holding after 7/30/90 days.
- Build a wash-trade filter (e.g., exclude self-trades, rapid back-and-forth between the same two wallets, or zero-fee venues).
Mini case
A dashboard tracks Collection A over 14 days:
- First-time buyer share rises from 22% to 37%.
- Holder retention at 30 days stays above 65%.
- Average time-to-resale stretches from 1.2 to 2.1 days.
Interpretation: discovery is onboarding new wallets and buyers feel less need to flip, a healthy signal for curation.
Common mistakes
- Treating prebuilt dashboards as truth—clone and adapt to your definitions.
- Ignoring query assumptions (e.g., missing transfers on certain bridges).
- Overfitting to a single chain when the collection trades cross-chain.
Synthesis: A custom dashboard turns vague hype into reproducible evidence, giving your curation a defensible backbone.
3. Wallet Labels & “Smart Money” Flows
Wallet-label platforms map clusters of addresses (funds, whales, market makers, prolific collectors) and expose their transactions as watchable signals. Following labeled “smart money” isn’t about copying trades; it’s about learning where sophisticated actors are allocating risk and when they exit. Nansen popularized the concept with Smart Money dashboards and also offers a portfolio view that consolidates holdings across chains. The practical workflow: subscribe to tagged wallet cohorts, monitor net inflows to specific collections, and set alerts when known curators or funds accumulate or rotate. Pair these signals with your dashboard metrics to avoid hero-worship—wallet labels are one input among many.
Tools/Examples
- Smart Money cohorts: follow labeled collectors, funds, marketplaces, and aggregators.
- Net flow trackers: view ETH/WETH/USDC flowing into or out of a collection’s marketplace contracts.
- Distribution charts: monitor concentration—if the top 10 wallets hold >30% of supply, risk is higher.
Numbers & guardrails
- Copy-trade brake: never act on a single wallet; require ≥3 independent labeled wallets showing net buys within 48 hours.
- Exit cue: if a cohort net outflows exceed 2% of supply in 24 hours, reassess thesis.
- Overlap check: confirm that rising “smart” net buys correlate with unique buyers ↑ on your dashboard.
Synthesis: Wallet labels are best used to contextualize trends: they can confirm organic interest or expose coordinated moves that your rankings alone won’t reveal.
4. Rarity & Trait Analytics (Understanding Scarcity Properly)
Rarity analytics estimate how uncommon a token’s traits are within a collection, and they remain central to curating art and collectible sets. The method varies—some tools score each trait inversely to its frequency and sum across traits; others use multiplicative “statistical rarity” or normalized variants. The goal isn’t a universal truth but a consistent ranking that helps you compare tokens within the same collection. Educational explainers describe how trait counts and rarity contribute to perceived value; you can use these to sanity-check a project’s trait schema and distribution. Pair rarity with market depth: a top-ranked token in a thin market can still be illiquid.
How to use it
- Pull the trait frequency table and inspect long tails—extremely rare traits (<1%) should be intentional, not accidental metadata noise.
- Compare rarity rank to bid/ask spread; wide spreads warn of low price discovery.
- Validate that traits are on-chain or reliably hosted; fragile metadata undercuts long-term curation.
Mini case
Within a 10,000-item collection:
- Token #4821 ranks Top 1% (rarity score driven by a 0.4% background + 0.7% accessory).
- The floor is 0.30 ETH, but #4821 last transacted at 1.1 ETH; current asks cluster at 0.95–1.2 ETH.
- Holder history shows 2 owners over 180+ days—sticky ownership supports premium.
Common mistakes
- Comparing rarity across different collections; only compare within a set.
- Ignoring trait correlations (e.g., rare backgrounds always paired with certain hats) that can skew simple scoring.
- Treating rarity as destiny; cultural resonance and provenance also drive value.
Synthesis: Use rarity to rank within a collection, then cross-check with liquidity and provenance to avoid purely cosmetic decisions.
5. Real-Time Alerts & Mint Monitors
Alerts compress reaction time. They catch new mints, sudden floor moves, whale buys, and listing walls before a daily dashboard refresh. Many NFT alert services route through node providers; for example, icy.tools has directed users to migrate alerting to QuickNode’s QuickAlerts, which deliver real-time chain events. The recipe is simple: subscribe to contract events (mints, transfers, approvals), marketplace events (listings, sales), and wallet activity (tracked addresses) with thresholds that reflect your strategy. Keep alerts scarce—too many pings and you’ll start ignoring them. icy.tools
Mini checklist
- Mint: cap notifications to first N blocks of a new collection to catch anomalies early.
- Floor move: alert at ±10% relative to 24-hour moving average.
- Whale buy: trigger on purchases ≥3× current floor or ≥0.5% of supply.
- Listing wall: notify when ≥50 new listings appear within +5% of floor.
Numbers & guardrails
- False-positive control: require 2 independent triggers (e.g., floor drop + listings surge) before acting.
- Alert diet: review rules weekly; if a rule never leads to action, delete it.
- Latency budget: prefer channels that deliver within ~1–3 seconds of block inclusion for mint watching.
Synthesis: Treat alerts as an early-warning system—they point you to events worth investigating, not decisions to execute blindly.
6. Metadata & Collection Research via APIs
When you need reliable trait data, token images, and collection metadata, use marketplace and project APIs to avoid scraping errors. OpenSea’s API exposes endpoints for token metadata, events, listings, offers, and collections; pulling directly from such structured sources lets you compute rarity and liquidity with fewer mismatches. Start by fetching the collection slug and base metadata, then iterate token-by-token to build your local dataset. Always cross-reference what you ingest with on-chain fields (token URI, contract address) to avoid spoofed or migrated collections. For aggregators that combine multiple marketplaces, keep an audit trail of where each listing came from so you can resolve conflicts.
How to do it
- Query collection info (slug, description, contract address), then fetch assets in batches.
- Parse traits and build a frequency index; export a CSV for reproducibility.
- Pull event streams (sales, listings) to compute velocity, spread, and depth.
- Store image URLs and confirm content hashes where available.
Common mistakes
- Assuming API fields map 1:1 to on-chain; always verify tokenURI and contract.
- Ignoring rate limits; cache responses and back off to avoid gaps.
- Forgetting to note timezone and block timestamps when aggregating events.
Synthesis: Direct API ingestion gives you the raw ingredients for trustworthy curation—clean traits, consistent events, and verifiable links to the contract.
7. Contract Explorers & Provenance Verification
Block explorers such as Etherscan let you verify the contract address, read token metadata pointers, inspect mint functions, and review transfers and holders. Explorer documentation covers token trackers and how to navigate pages for ERC-721 collections, and the API exposes endpoints for ERC-721 token inventories and holder data. For curation, provenance means confirming you’re looking at the canonical contract, that metadata is stable (ideally immutable or decentralized), and that ownership flows make sense (no suspicious loops). A fast provenance check before you celebrate a “trend” can save you from indexing derivatives or spoofed contracts.
How to do it
- Confirm contract address from the project’s official channels; paste into the explorer.
- Check Contract > Read/Write tabs to see minting and reveal functions; verify owner or proxy roles.
- Inspect holders: top-10 concentration and changes over the last N transfers.
- Review Transfers for self-trading patterns or rapid round-trips between a few addresses.
Mini case
You spot a “trending” set on a marketplace. On Etherscan, holders show 2 wallets controlling 28% of supply, and 40 transfers in the last 2 hours are back-and-forth between the same pair at negligible deltas. That’s likely inorganic. You discard it and move on.
Synthesis: Explorers anchor your curation to first principles—the contract is the source of truth, and that truth is public.
8. Indexing & Data Pipelines (The Graph & Subgraphs)
If you want repeatable analysis at scale, index data into your own shape. The Graph is a decentralized protocol for querying blockchain data with “subgraphs” that define how events are ingested and exposed via GraphQL. The Graph Explorer and related docs show how to discover existing subgraphs and interact with them; many NFT projects publish subgraphs that track mints, transfers, listings, and sales. For curators, building or adopting a subgraph means you can query reliable, versioned data without scraping or running a full node. It also lets you unify multi-chain collections under one query interface, which simplifies cross-market trend tracking.
Tools/Examples
- Project subgraphs: many collections expose mints, metadata updates, and sales as entities.
- Curator subgraphs: build your own that normalizes events across marketplaces.
- Substreams: when available, stream higher-volume events for near-real-time dashboards.
Numbers & guardrails
- Freshness target: aim for <1 minute block-to-index latency for alert-adjacent use cases.
- Schema stability: version schemas and document entity changes; breaking changes cause silent query failures.
- Error budget: define <0.5% acceptable missing events; reconcile against explorer counts weekly.
Synthesis: Indexing gives you data you can depend on, turning ad-hoc analysis into a durable curation pipeline.
9. Cross-Chain Activity Aggregators
Activity rarely stays on one chain. Cross-chain aggregators report sales, traders, and volume across multiple networks, helping you avoid tunnel vision. DappRadar explains how it tracks thousands of dapps across dozens of blockchains and publishes NFT-specific rankings, so you can see when a collection migrates or when a look-alike starts moving elsewhere. Cross-chain context is critical: a lull on one chain may reflect liquidity shifting, not a dying trend. Build a view that merges chain-level metrics with your collection list, and always specify the network when you talk about “volume” or “holders.”
How to use it
- Maintain a chain column in every dataset; never aggregate across chains without labeling.
- Compare share of volume by chain over rolling windows to spot migrations.
- Monitor bridge inflow/outflow patterns for related tokens if a collection has a fungible component.
Common mistakes
- Treating “top” lists as universal when they’re chain-specific.
- Ignoring marketplace fragmentation; a top collection on one chain may barely list on another.
- Overlooking gas economics that change trading patterns.
Synthesis: A cross-chain lens prevents false negatives—trends often move sideways across networks before they move up or down.
10. Portfolio, P&L, and Accounting-Friendly Tracking
Curating over time means tracking positions, costs, and outcomes—preferably across wallets and chains. Portfolio tools consolidate holdings, log realized/unrealized P&L, and visualize risk by collection. Nansen describes a multi-chain portfolio experience alongside its research and labeling ecosystem, and NFTGo provides developer docs and APIs for portfolio endpoints and collection data. Whether you’re a collector, gallery, or fund, build a consistent ledger: acquisition price, fees, royalties, and realized outcomes, plus notes on your curation thesis. That record keeps you honest when narratives shift.
How to do it
- Export holdings and transactions weekly; reconcile against explorer data.
- Compute true cost basis: price + marketplace fee + royalty + gas.
- Tag positions by thesis (art, historical, community utility) to review outcomes by category.
- For multi-wallet setups, maintain a master wallet map so you can evaluate at the collection level.
Mini case
You acquire 12 tokens across 4 collections with a total cost basis of 8.5 ETH. After 90 days, realized gains are 1.6 ETH, unrealized P&L is –0.4 ETH, and your best performers are those tagged “historical.” Action: tighten future curation around that tag and reduce exposure to “utility-promised” sets.
Synthesis: A clear ledger makes your curation accountable—you’ll learn which theses actually work, not just which stories sound good.
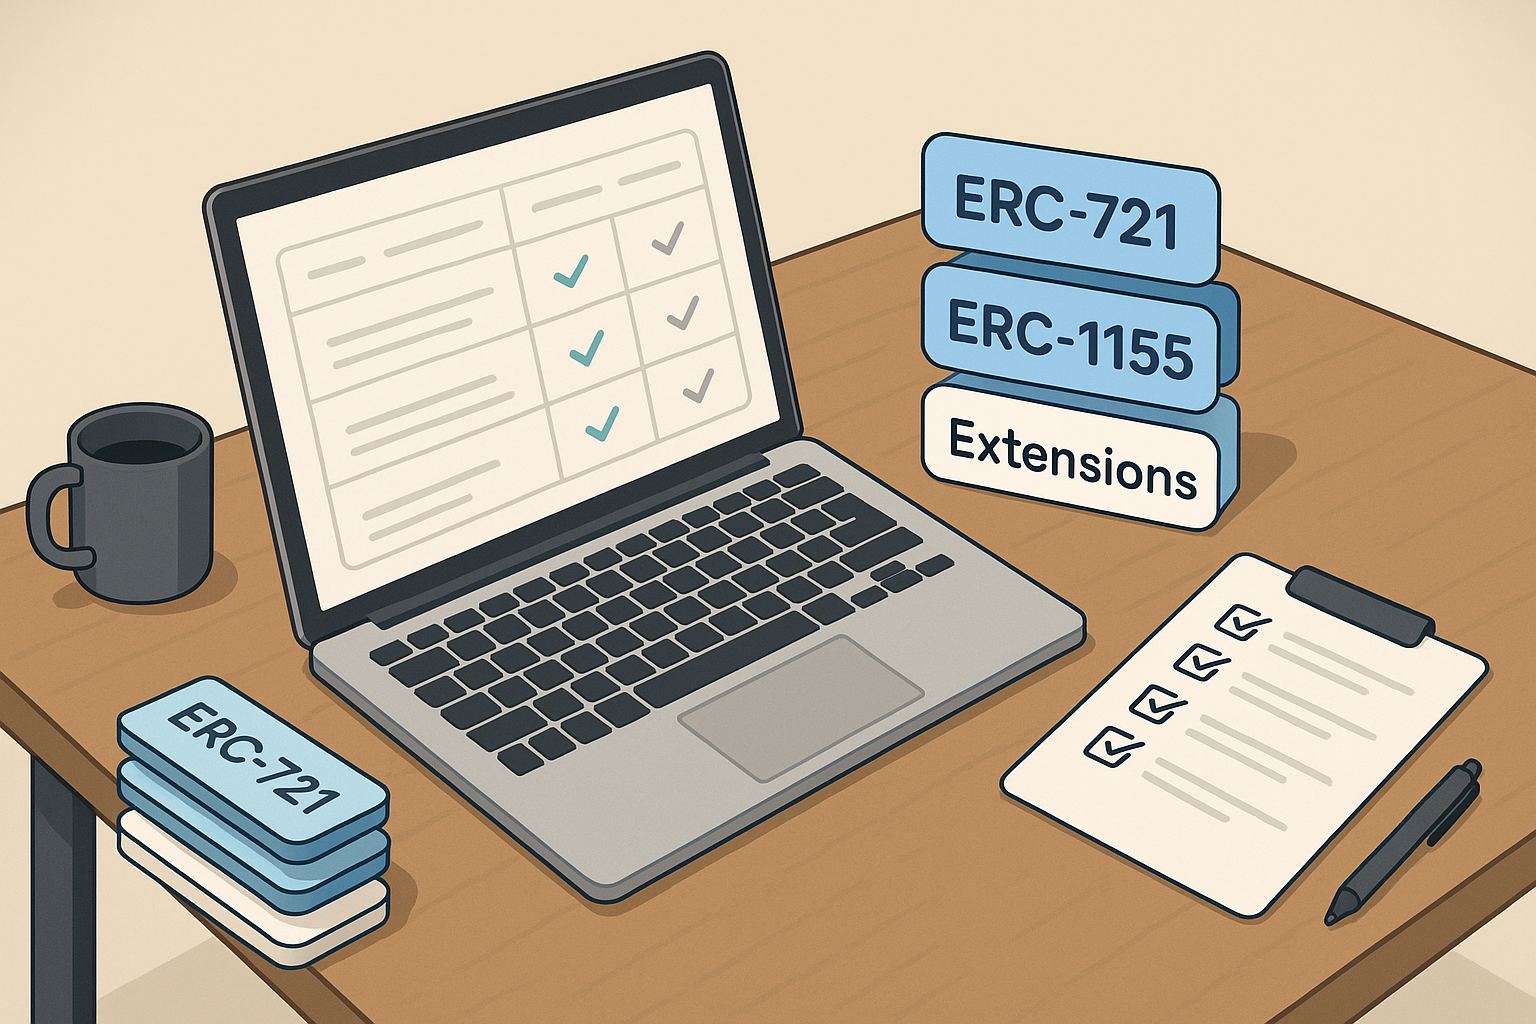
11. Standards Literacy (ERC-721 & ERC-1155) for Accurate Curation
Understanding token standards helps you interpret data correctly. ERC-721 defines non-fungible tokens with unique IDs and a standard interface for ownership and transfer; ERC-1155 generalizes the model to support both fungible and non-fungible types within a single contract. Ethereum’s documentation and the EIPs themselves explain the functions and events these standards must implement. For curation, standards literacy clarifies how to read token IDs, batch transfers, approvals, and metadata pointers; it also explains why some collections can merge fungible and non-fungible items (e.g., editions plus uniques). When you know the interface, you avoid mislabeling events and can build more precise queries and alerts.
How to use it
- Map events to meaning: Transfer, Approval, URI updates; track them in your dashboards.
- In ERC-1155, handle batch events that move many token IDs at once—don’t double-count volume.
- Verify metadata mutability: is the URI fixed, frozen, or upgradeable?
Numbers & guardrails
- Batch sanity: when parsing ERC-1155, ensure the sum of amounts matches your row counts; drift > 0.1% flags a bug.
- Upgrade risk: if a collection can update metadata, set a notification for any URI change events.
- ID space: confirm there are no collisions or reused IDs before computing rarity.
Synthesis: Standards knowledge turns the NFT landscape from mystery into a spec, letting you curate with confidence and fewer analytic errors.
12. Social & Sentiment Signals (Integrated with On-Chain Data)
Social metrics—mentions, follows, Discord growth—are not replacements for on-chain evidence, but they round out the picture when used carefully. Look for tools that integrate social feeds with wallet flows and marketplace events, so you can test whether buzz coincides with real purchases. Some platforms provide extensions or bots to surface mints or whales in social contexts; developer docs from analytics providers outline features for watchlists, alerts, and even Discord integrations. Treat social spikes as hypotheses: if a shout-out doesn’t move unique buyers or floor depth, it’s marketing, not momentum.
How to do it
- Track follower deltas and engagement rate for official project accounts alongside on-chain volume.
- Join Discord and watch announcements vs. listings; real adoption shows as listings absorbed, not just emojis.
- Monitor community health: moderation quality, roadmap clarity, and response to issues.
Mini checklist
- Correlation test: require social spikes to be followed by unique buyers ↑ within 24–48 hours.
- Bot sniff: sudden follower bursts without on-chain change → deprioritize.
- Sustainability: prefer steady, compounding engagement over singular viral hits.
Synthesis: Social is your context engine—use it to prioritize research, but let the chain and the market confirm what truly matters.
Conclusion
A durable curation workflow blends discovery, verification, and accountability. Start with marketplace rankings to spot candidates, then pressure-test them against on-chain dashboards that measure breadth, retention, and liquidity. Layer wallet-label insights to understand where sophisticated participants are allocating attention, and validate collection design with rarity analytics and clean metadata. Keep your reaction time sharp with targeted alerts, and ground every thesis in contract-level provenance checks. As your practice matures, rely on indexing pipelines and cross-chain views to scale your coverage without sacrificing accuracy. Finally, track your positions and theses rigorously so you can learn from outcomes, and use social metrics as hypotheses to prioritize, not as conclusions to act on. Do these consistently and you’ll curate with clarity, lower noise, and higher confidence—ready to share better lists, build stronger exhibitions, or simply collect with purpose.
Copy-ready CTA: Build your dashboard, set two alerts, and verify your next shortlist on an explorer before you decide.
FAQs
1) What’s the single most telling metric for NFT trend quality?
There isn’t one. Look for confluence: increasing volume and more unique buyers, stable or rising holder counts, and absorbable floor depth. If just one metric flashes (for example, volume spikes while sales count drops), you might be seeing a single high-priced trade rather than broad demand. Combining three or more confirming signals reduces false positives.
2) How do I filter out wash trading when curating?
Exclude self-trades and ping-pong trades between the same two wallets over short intervals, ignore zero-fee venues if applicable, and compare sales price to prevailing floor to spot outliers. Many analytics platforms or docs provide techniques and even tutorials on filtering suspect patterns—use these as starting points and validate against explorer histories for the collection you’re studying.
3) Are rarity scores “real,” or should I ignore them?
Rarity scores are relative ranking tools within a collection, not universal truths. They’re most helpful for comparing pieces from the same set when you also consider liquidity and cultural significance. Educational explainers show common scoring methods—trait-frequency inversion or statistical combinations. Treat rarity as one input and always cross-check with market depth and provenance.
4) What’s the difference between ERC-721 and ERC-1155 for curators?
ERC-721 defines unique tokens; ERC-1155 allows both unique and semi-fungible tokens under one contract, including batch transfers. For curation, that means you must parse events correctly and avoid double counting volume when batches move. Understanding the standard clarifies why some collections have “editions” alongside 1/1s and how metadata updates are signaled.
5) How can I tell if a “trending” collection is the real one and not a copy?
Always verify the contract address via official links and inspect it on a block explorer. Confirm token IDs, metadata URIs, and holder distribution. If in doubt, compare marketplace listings that point to different contracts and check which contract has consistent history and owner patterns. Explorer docs and APIs provide detailed token and holder views to help you decide.
6) Do I need to code to build useful dashboards?
Not necessarily. Many community dashboards are clonable, and platforms offer visual editors. That said, learning a bit of SQL (or GraphQL when using subgraphs) pays off quickly: you’ll be able to tweak filters, define retention cohorts, and automate your own metrics instead of relying on generic ones. The official documentation for these platforms is a good place to start.
7) How often should I review my curation shortlist?
Weekly works for many curators: it balances freshness with enough data to reduce noise. If you’re tracking fast-moving mints, layer real-time alerts for the first few days, then settle into your weekly dashboard review. The key is consistency—use the same metrics and thresholds so you can compare apples to apples over time.
8) Which is better: marketplace rankings or wallet-label tools?
They serve different jobs. Rankings are discovery; wallet-labels are context. Use rankings to find candidates and labeled wallets to validate whether sophisticated participants care. When both align—growing breadth with net smart-money inflows—you have a stronger case to research further.
9) How do I compare activity across chains?
Keep chain labels in every table you build, and prefer aggregators that publish cross-chain methodologies. Compare the share of volume by chain for a collection and watch for migrations over time. Don’t assume inactivity on one network means a trend is over; it might have moved.
10) What should I log for portfolio and P&L tracking?
Capture acquisition price, royalties, marketplace fees, and gas for true cost basis. Tag each position by thesis (e.g., art, historical significance, utility) and review outcomes by tag each month. Portfolio tools and APIs help consolidate multi-chain holdings so you can see exposure at a glance and evaluate what’s actually working.
11) Do social metrics actually predict on-chain movement?
Sometimes, but treat them as hypotheses. Test whether social spikes coincide with rising unique buyers or floor absorption within a defined window. If you can’t find consistent correlations, deprioritize that source. Some platforms offer extensions or bots to surface on-chain events in social spaces, which can help you run these experiments more systematically. NFTGo Documentation
12) How can I make my process more repeatable?
Write down your definitions (breadth ratio, retention thresholds), save your queries, and keep a weekly ritual: refresh dashboard → review alerts → verify provenance → update ledger. Over time, build or adopt a subgraph so your data shape and freshness are under your control, and maintain a minimal set of alert rules that still get your attention when it matters.
References
- ERC-721: Non-Fungible Token Standard, Ethereum Improvement Proposals (EIPs), 2018 — https://eips.ethereum.org/EIPS/eip-721
- ERC-1155: Multi Token Standard, Ethereum Improvement Proposals (EIPs), 2018 — https://eips.ethereum.org/EIPS/eip-1155
- ERC-1155 Multi-Token Standard, Ethereum.org, 2025 — https://ethereum.org/developers/docs/standards/tokens/erc-1155/
- OpenSea API Overview, OpenSea Docs — https://docs.opensea.io/reference/api-overview
- List Collections Endpoint, OpenSea Docs — https://docs.opensea.io/reference/list_collections
- Welcome to Dune Docs, Dune Docs — https://docs.dune.com/
- Create Dashboards, Dune Docs — https://docs.dune.com/web-app/dashboards
- Smart Money, Nansen — https://app.nansen.ai/smart-money
- The Best Tools to Track Your Crypto Portfolio Across Multiple Chains, Nansen — https://www.nansen.ai/post/the-best-tools-to-track-your-crypto-portfolio-across-multiple-chains-in-2025
- Rankings, DappRadar Docs, 2025 — https://docs.dappradar.com/rankings
- NFT Rankings, DappRadar Docs — https://docs.dappradar.com/rankings/nft-rankings
- Etherscan Tokens API, Etherscan Docs, 2025 — https://docs.etherscan.io/api-endpoints/tokens
- Etherscan Information Center: Token Tracker Tutorial, Etherscan — https://info.etherscan.com/tag/tutorials/
- Graph Explorer Docs, The Graph — https://thegraph.com/docs/en/subgraphs/explorer/
- Explore Subgraphs, The Graph — https://thegraph.com/explorer
- The Graph | Palm Network Docs, Palm Network — https://docs.palm.io/howto/use-supported-tools/thegraph/
- What Is NFT Rarity?, Hedera Learning — https://hedera.com/learning/nfts/nft-rarity