A unicorn is a privately held company valued at $1 billion or more. When you’re comparing unicorns by industry, you’re really asking which sectors most reliably compound demand, margins, and capital to cross the billion-dollar threshold. This guide answers that, shows you how to read sector patterns, and gives you guardrails to sanity-check hype. It is educational content—not investment, legal, or tax advice. Always do independent diligence with qualified professionals.
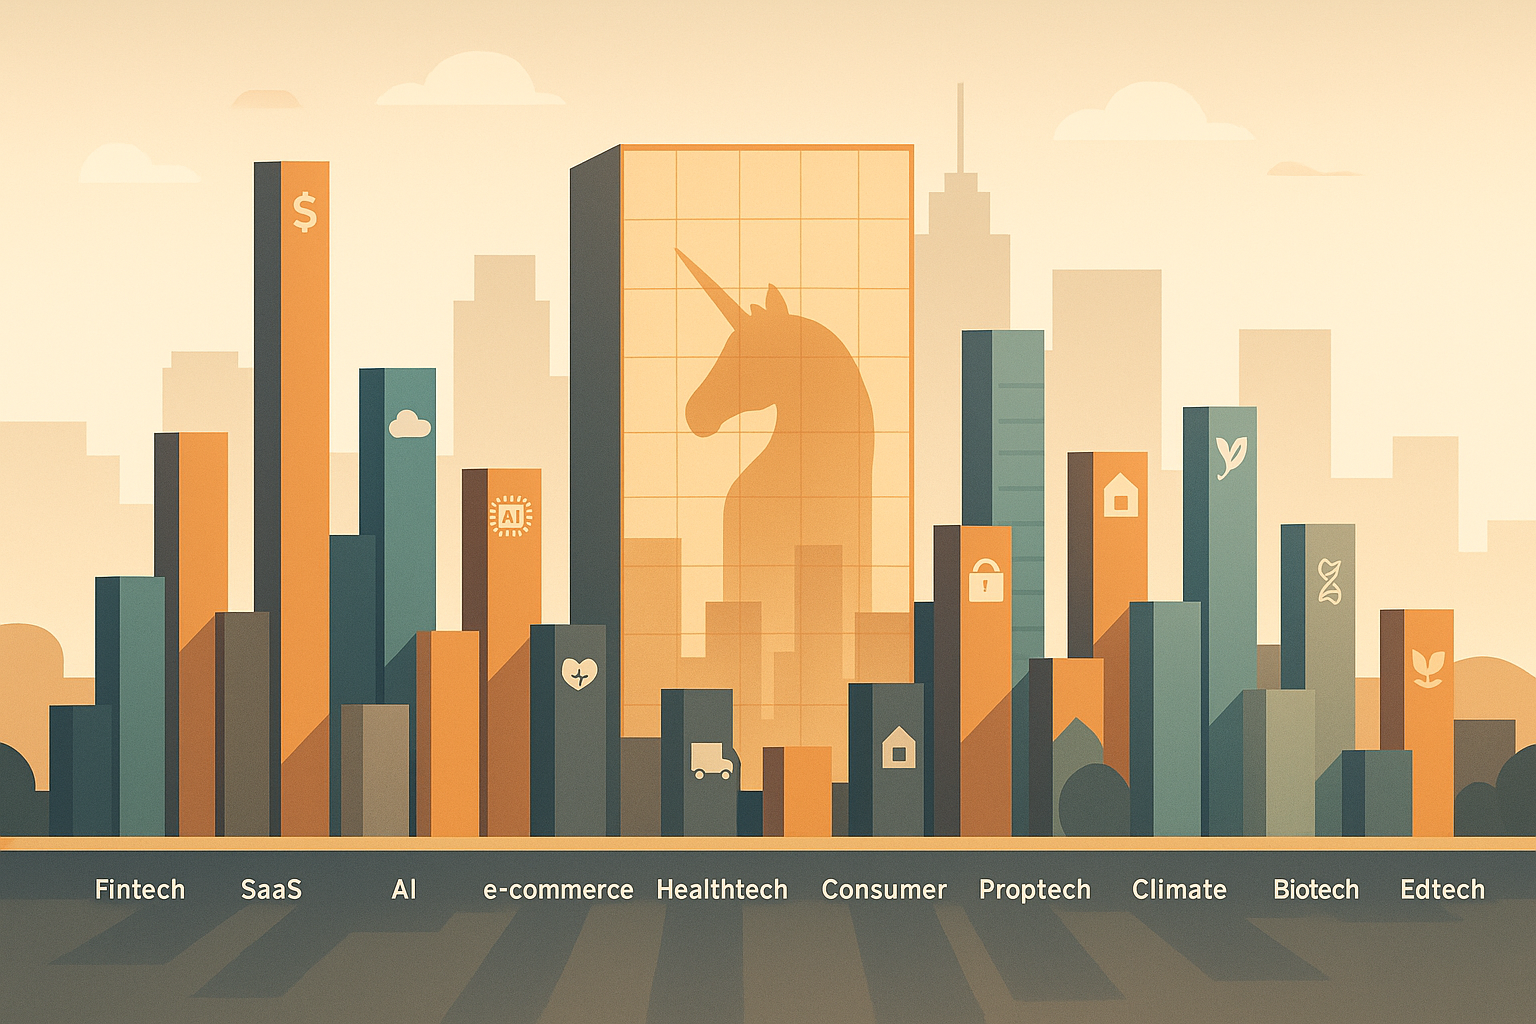
Short answer: The sectors that most consistently mint unicorns are fintech, enterprise software/SaaS, e-commerce and marketplaces, AI & data infrastructure, healthtech and biotech, cybersecurity, logistics & mobility, consumer/social, proptech, climate tech & energy, and edtech. Several live trackers from major data providers corroborate these leaders and let you filter by sector and geography.
Skimmable steps to analyze any sector’s unicorn potential:
- Define the sector precisely (taxonomy matters).
- Normalize for business model (B2B vs B2C) and revenue quality (recurring vs transactional).
- Check unit economics (gross margin, CAC payback, contribution profit).
- Model capital intensity (capex, working capital, burn).
- Map exit paths (IPO/M&A density).
- Assess regulatory friction and compliance cost.
- Weigh talent/tooling tailwinds (platforms, APIs, infra).
- Stress-test with downside scenarios (pricing compression, churn spikes, capital drought).
Quick sector comparison (typical ranges; directional, not prescriptive)
| Sector archetype | Sales cycle | Typical gross margin | Capital intensity |
|---|---|---|---|
| Enterprise SaaS | Weeks–months | 70–90% | Low–moderate |
| Fintech (lending/payments) | Instant–months | 30–80% (by model) | Moderate–high |
| E-commerce/Marketplace | Instant | 15–50% (take-rate driven) | Moderate (inventory/logistics) |
| AI & Data Infra | Weeks–months | 60–95% | Moderate (GPU/cloud) |
| Healthtech (digital) | Months | 40–75% | Moderate (compliance) |
| Biotech | N/A (R&D milestones) | N/A (pre-revenue) | Very high |
How to read it: shorter cycles + high margins + scalable demand = more frequent unicorn formation; high capital intensity can still work if margins and TAM (total addressable market) offset. For current company-level data, consult live dashboards by CB Insights, Crunchbase, Dealroom, and PitchBook.
1. Fintech
Fintech produces many unicorns because money is a universal workflow and financial plumbing sits under nearly every transaction you and your customers make. The sector spans payments, banking-as-a-service (BaaS), lending, wealth/insurtech, crypto, compliance/KYC, and infrastructure (cards, ledgers, risk tools). The fastest paths to a $1B+ valuation typically combine large daily volumes with wedge features (for example, instant payouts) that expand into multi-product suites. Fintech also benefits from strong network effects: more users improve risk models, unit costs, and partner leverage. The trade-off: regulatory scrutiny and balance-sheet risk (for credit/float models). Live trackers consistently show fintech among the top sectors by unicorn count globally.
Why it leads
- Massive TAM: every payment, account, and loan is a potential customer relationship.
- Monetization levers: interchange, take-rates, net interest margin (NIM), SaaS fees, FX spreads.
- Composability: APIs (issuing, acquiring, KYC) let companies ship fast and bundle services.
- Data flywheels: better underwriting/anti-fraud with scale.
- Global portability: the core problems rhyme across regions even when regulations differ.
Numbers & guardrails
- Gross margins: ~30–80% depending on model (highest for pure software, lower for credit-heavy).
- CAC payback: under 12 months is a strong signal in SMB/consumer; enterprises can be longer.
- Credit models: target net charge-offs below low-single-digit % of receivables in mature books.
- Payments take-rates: often 0.5–3.0% blended; watch processing/FX costs.
Mini case
A B2B payouts platform processes $6.0 billion GPV with a 0.9% blended take-rate and 30% contribution margin after variable costs. Contribution profit ≈ $16.2 million; with 3× YoY GPV growth and <9-month payback, it can justify growth-stage multiples typical of fintech infrastructure—often enough for unicorn status when paired with strong cohort retention, as seen across many names on leading trackers.
Synthesis: Fintech’s ubiquity, monetization diversity, and data compounding explain why it repeatedly tops the unicorns by industry lists—just ensure risk, compliance, and funding costs scale sanely.
2. Enterprise Software & SaaS
Enterprise SaaS is a prolific unicorn factory because it sells mission-critical, recurring software with high margins and clear ROI. Products that automate workflows (ERP, CRM, security, data stacks, vertical SaaS) ride expansion revenue—seat growth, usage-based pricing, modules—and enjoy sticky net retention when switching costs are high. Go-to-market motions vary (PLG, sales-led, or hybrid), but the outcome is similar: predictable revenue that compounds. Trackers frequently show enterprise software or closely named sectors among the top cohorts by unicorn count.
Why it leads
- Recurring revenue with 70–90% gross margins.
- Budget line ownership: replaces legacy tools or manual processes.
- Scalable distribution: bottoms-up PLG can compress CAC; enterprise sales add ACV.
- Ecosystem gravity: integrations and marketplaces increase lock-in.
- Defensibility: data moats, admin sprawl, and workflow centrality.
Numbers & guardrails
- Net dollar retention (NDR): >120% is strong in mid-market; >130% in enterprise is elite.
- CAC payback: <18 months acceptable for enterprise with high NDR; <12 for SMB/PLG.
- Gross margin: 70–90%; if usage cloud costs push below 65%, revisit pricing/infra.
Mini case
A vertical SaaS for auto repair shops reaches $40 million ARR with 82% gross margin, 125% NDR, and 14-month payback. With 30% growth and disciplined burn, market trackers commonly include businesses like this in the unicorn set once growth and margin quality are sustained, reflecting the sector’s efficiency profile.
Synthesis: High-margin recurring revenue plus expansion dynamics make enterprise SaaS one of the most reliable unicorn engines.
3. E-commerce & Marketplaces
E-commerce and marketplaces mint unicorns when they aggregate demand and orchestrate supply with trust, logistics, and payments. The core flywheel: more buyers attract more sellers, lowering prices and improving selection, which in turn attracts more buyers. Unit economics hang on take-rate, fulfillment costs, returns, and fraud. Marketplaces also unlock new categories (B2B procurement, services, rentals), not just retail goods. Top trackers continuously list hundreds of marketplace/e-commerce unicorns across geographies, a sign of this model’s repeatability.
Why it leads
- Two-sided network effects and defensible liquidity.
- Non-linear growth once a marketplace crosses density thresholds.
- Monetization variety: take-rate, ads, logistics services, subscriptions, financing.
- Category expansion: attach B2B tools (catalog, invoicing) or consumer services (returns, BNPL).
Numbers & guardrails
- Take-rate: commonly 5–25% depending on category/service depth.
- Contribution margin: target positive after variable logistics/returns by cohort month 3–6.
- Return rates: keep fashion <25% and general merchandise <10% or re-price and re-assort.
- Fraud/shrink: monitor basis points vs. payment mix and risk tooling.
Mini case
A niche B2B marketplace reaches $700 million GMV with a 9% take-rate and 40% contribution margin after logistics add-ons. That’s $63 million net revenue and $25 million contribution profit. Liquidity concentrates into core SKUs; adding financing lifts take-rate to 11% on financed orders, pushing valuation potential firmly into unicorn territory seen on global lists.
Synthesis: Liquidity plus layered monetization explains why e-commerce/marketplaces remain a staple of unicorn formation despite thin headline margins.
4. AI & Data Infrastructure
AI & data infrastructure has become a breakout unicorn engine by coupling exploding compute with software leverage. The stack spans foundation/model providers, fine-tuning and orchestration, vector databases, ML ops, agent platforms, GPU scheduling, and vertical AI apps. Many AI unicorns show tiny teams with outsize output thanks to model efficiencies; trackers and recent coverage highlight several with lean headcounts achieving billion-plus valuations.
Why it leads
- Performance curves: predictable gains from better models/data/tooling.
- Usage-based pricing aligns value and scales fast.
- Developer adoption: APIs/SDKs reduce integration friction.
- Ecosystem pull: hyperscaler credits, marketplaces, and chip supply unlock growth.
Numbers & guardrails
- Gross margin: 60–95%, but watch inference costs; reserve instances and batching matter.
- Unit economics: strive for >70% model-usage margin at target scale; pass through spikes carefully.
- Security/compliance: SOC 2, GDPR, HIPAA where relevant; model governance is now table stakes.
Mini case
An AI data-ops platform charges $0.35 per 1,000 processed events. At 12 billion events/month, net revenue is $4.2 million/month with 78% gross margin. With viral SDK adoption and negative net churn (expansion outweighs logo loss), the company’s growth mirrors many AI names that have quickly entered unicorn boards.
Synthesis: When compute cost curves and developer demand align, AI infrastructure can scale faster than headcount—one reason it now ranks among top unicorn sectors on major trackers.
5. Healthtech (Digital Health)
Digital health produces unicorns by modernizing care delivery, payer/provider operations, and patient engagement. Think virtual care, care navigation, revenue-cycle software, clinical decision support, benefits platforms, and data interoperability. The big lever is converting waste and friction into measurable outcomes: faster prior auths, fewer no-shows, better adherence. Sector leaders often combine SaaS with value-based care or payments to align incentives. Healthtech consistently appears near the top of industry breakouts in trusted unicorn databases.
Why it leads
- Large, inefficient markets drive outsized ROI for automation.
- Reimbursement innovation enables novel care models.
- Data liquidity (EHRs, claims, device signals) unlocks new tooling.
- Enterprise contracts create durable revenue with long terms.
Numbers & guardrails
- Gross margin: 40–75% depending on services mix.
- CAC payback: <18 months for enterprise; <12 for employer benefits GTM.
- Outcome contracts: define clear metrics (readmission reduction %, visit throughput, wait-time SLAs).
Mini case
A virtual specialty clinic sells to employers at $7–$12 PMPM (per member, per month). With 200,000 covered lives at $9 PMPM, ARR ≈ $21.6 million. If claims data show a >10% reduction in avoidable procedures and a 4× ROI for employers, renewals and expansions typically lift valuations into the unicorn range over time as seen in sector trackers.
Synthesis: Healthtech’s ability to tie software to outcomes drives unicorn formation even with compliance complexity.
6. Biotech & Biopharma
Biotech mints unicorns by de-risking scientific breakthroughs along a staged path (discovery → preclinical → trials → approval). Value accretes at milestone gates—indications validated, safety/efficacy signals achieved, partnerships inked. Unlike SaaS, early biotech may be pre-revenue for years, yet still reach unicorn status due to the option value of pipelines and platforms (gene editing, cell therapies, AI-designed molecules). Major unicorn trackers maintain robust biotech cohorts alongside tech categories.
Why it leads
- Binary but large outcomes: one approval can justify large value.
- Platform effects: multiple programs leverage the same engine.
- Non-dilutive capital: grants/partnerships reduce burn.
- Strategic exits: pharma M&A pipelines require external innovation.
Numbers & guardrails
- Runway: plan ≥24 months to clear the next major milestone.
- Portfolio math: balance high-risk/high-reward programs with nearer-term assets.
- Probability-of-success: stage-adjusted; model blended EV across pipeline.
Mini case
A platform biotech with 3 lead programs projects a 15% likelihood of success for its most advanced asset and 8% for two earlier ones. Expected value math plus $300 million in partnered milestones can justify a unicorn valuation before revenue—a pattern reflected in many biotech entries across trackers.
Synthesis: Biotech’s milestone-driven valuations explain frequent unicorn appearances despite long timelines and scientific risk.
7. Cybersecurity
Security repeatedly breeds unicorns because risk never sleeps and budgets rarely shrink. The surface area grows with cloud, SaaS sprawl, and AI. Segments include identity, endpoint/XDR, cloud posture (CSPM), data security, application security, DevSecOps, and governance, risk, compliance (GRC). Buyers pay for reduced breach probability and faster incident response. Trackers list dozens to hundreds of security unicorns spanning these sub-sectors.
Why it leads
- Mandatory spend driven by compliance and board oversight.
- Fast cycles for urgent pain (breach → budget unlocked).
- Consolidation waves: platforms absorb point tools over time.
- Telemetry moats: more signals → better detection → lower false positives.
Numbers & guardrails
- Win rates: >25% in qualified enterprise deals signal product/market fit.
- Rule of 40: strong security companies often sustain >40 at scale.
- Deployment time: hours/days beat weeks; ease of rollout correlates with NDR.
Mini case
An identity startup prices at $8 per monthly active user for workforce apps, landing 50,000 MAUs in year one ($4.8 million ARR). Expansion into privileged access bumps ARPU to $14, and a 130% NDR profile pushes modeled value to unicorn territory, echoing patterns visible on live unicorn boards.
Synthesis: Board-level urgency, measurable ROI, and platform consolidation keep cybersecurity near the top of unicorn-rich industries.
8. Logistics, Supply Chain & Mobility
This sector turns complexity into leverage—routing, warehousing, freight, last-mile, returns, fleet, and mobility platforms. Unicorns emerge when software orchestrates physical flows and slashes working capital or miles per delivery. Hardware may play a role (autonomy, sensors), but the defensibility often lives in data networks and contracted capacity. Global lists regularly include logistics/mobility unicorns due to commerce scale and efficiency gains.
Why it leads
- Trillion-dollar flows: small efficiency gains create big dollars.
- Data network effects: more shipments → better ETAs → more shippers.
- Embedded finance: factoring, insurance, and payments increase margins.
- Ecosystem APIs: carriers, customs, and warehouse systems now integrate.
Numbers & guardrails
- On-time delivery (OTD): target >95% in mature lanes.
- Cost per drop: drive toward single-digit currency units in dense metros.
- Gross margin: 20–60% depending on asset-light vs asset-heavy mix.
Mini case
A freight network handles 120,000 monthly loads at $80 gross profit per load → $9.6 million monthly gross profit. With optimized backhauls and embedded financing adding 2–3 points of take-rate, the platform economics map closely to logistics unicorns seen on major trackers.
Synthesis: When software tames physical complexity, logistics businesses can scale to unicorn valuations even with moderate margins.
9. Consumer & Social Media
Consumer/social unicorns capture attention, identity, and community, converting them into ads, subscriptions, commerce, or creator tools. The model is hits-driven but scalable: a single product can reach hundreds of millions of users quickly. Defensibility stems from network effects, creator ecosystems, and distribution (app stores, influencers). Unicorn trackers often include sizeable consumer/social cohorts—especially where new content formats or devices emerge.
Why it leads
- Zero marginal cost to serve another user (after infra).
- Virality: organic loops can replace paid acquisition.
- Creator economy: tooling and revenue-share models deepen engagement.
- Commerce attach: social shopping and live commerce add new revenue lines.
Numbers & guardrails
- DAU/MAU: >30% indicates habit; >50% is elite.
- Retention: day-30 >25% for consumer apps is a good sign; varies by category.
- Ad ARPU: depends on geography and format; optimize for session depth, not just impressions.
Mini case
A social app hits 10 million MAUs with 35% DAU/MAU and 6 sessions/day. With $0.10 ad ARPU/day in core regions and 60% gross margin after infra, annualized revenue approaches $219 million. With sustained retention and creator payouts that recycle engagement, such profiles frequently populate consumer unicorn lists.
Synthesis: Audience scale plus monetization diversity can power consumer/social companies into unicorn territory—if retention clears habit thresholds.
10. Proptech & Real Estate
Proptech unicorns modernize transactions, financing, property management, construction, and data/valuation. Real estate’s sheer asset base means even small workflow improvements or interest-rate advantages create large value. Models range from marketplaces and SaaS to embedded finance and analytics. Despite cyclical headwinds, trackers continue to show proptech names reaching unicorn valuations when they create liquidity or reduce friction for owners, operators, and tenants.
Why it leads
- High-value transactions justify meaningful fees.
- Fragmented stakeholders (brokers, lenders, managers) = software opportunity.
- Data moats from unique comps, permits, IoT.
- Attach products: insurance, warranties, payments, energy services.
Numbers & guardrails
- Take-rate/fees: 0.5–3% of GMV for transactions; SaaS $5–$50 per unit/month in property ops.
- Churn: keep gross churn <2%/month for SMB property managers; enterprise is lower.
- Regulatory: licensing and local rules—budget compliance into CAC/payback.
Mini case
A B2B prop-ops platform manages 400,000 units at $8/unit/month → $38.4 million ARR, 78% gross margin, 120% NDR with add-ons (maintenance, rent payments). This pattern—SaaS base with fintech attach—is common among proptech unicorns cataloged by global databases.
Synthesis: Real estate’s value density and operational complexity make it fertile ground for unicorn-scale software plus finance bundles.
11. Climate Tech & Energy
Climate tech unicorns scale where decarbonization meets economics: electrification, storage, grid software, EV ecosystem, industrial efficiency, carbon accounting, and materials. The winners align policy incentives, cost curves, and customer ROI. While some plays are capital-intensive, software layers (trading, optimization, asset management) deliver SaaS-like margins. Live trackers increasingly segment climate/energy as a distinct unicorn cohort.
Why it leads
- Regulatory and corporate mandates drive demand.
- Learning curves reduce unit costs (e.g., batteries).
- Infra + software pairing: hardware yields data; software monetizes it.
- New marketplaces: RECs/GOOs, carbon, flexibility markets.
Numbers & guardrails
- Project IRR: target double-digit post-incentive for distributed assets.
- Software margin: >70% for grid/asset optimization tools.
- Payback: behind-the-meter upgrades often aim for <5 years via energy savings and incentives.
Mini case
An energy management platform controls 1.5 GW of distributed resources, earning $2.50/kW-year in software and $5–$15/kW-year via market participation. Blended revenue $11.25 million/year with 75% gross margin supports expansion into new geographies, a path typical of climate tech names listed by sector on unicorn trackers.
Synthesis: Climate tech reaches unicorn scale where policy tailwinds and unit-economics converge—and software turns assets into recurring revenue.
12. Edtech
Edtech unicorns arise when platforms meaningfully improve learning outcomes, credentialing, or institutional efficiency—from consumer learning apps to workforce upskilling, assessment, and school administration. The sector’s growth correlates with digital penetration in classrooms and enterprises plus measurable skill gaps. Although procurement can be seasonal and budgets tight, category leaders show strong retention when they tie learning to career mobility. Global trackers maintain durable edtech cohorts, especially in workforce and language learning.
Why it leads
- Large addressable audience: learners and employers worldwide.
- Recurring models: subscriptions, cohorts, B2B licenses.
- Outcome linkage: certifications and placement improve willingness to pay.
- Distribution: creators and institutions act as channels.
Numbers & guardrails
- B2C retention: aim for day-30 >20%, LTV/CAC >3 at steady state.
- B2B ACV: from $10,000 (SMB) to $1,000,000+ (enterprise programs).
- Completion rate: >60% for cohort-based courses with live support is a good sign.
Mini case
A workforce platform sells $250/seat/year to 120,000 active learners via employer deals → $30 million ARR, 72% gross margin, with an 18-month logo payback. Layering assessment + placement fees takes blended ARPU to $340 and pushes valuation into the unicorn range common in leading edtech cohorts.
Synthesis: Edtech gets to unicorn scale when it provably advances careers and institutions—not just content breadth.
Conclusion
When you analyze unicorns by industry, a pattern emerges: sectors that mint unicorns at scale pair large, recurring demand with high margins or high frequency, add platform effects or data moats, and maintain credible exit paths. Fintech and enterprise software/SaaS keep leading because money and workflows touch everything. E-commerce/marketplaces, AI, and cybersecurity form repeatable engines via network and data effects. Healthtech/biotech, proptech, logistics, climate, consumer, and edtech rise when their economics outpace friction (regulatory, capital, seasonality). Your playbook: define the sector, normalize revenue quality, measure unit economics and capital intensity, model exits, and pressure-test compliance and platform dependencies. Apply the numbers & guardrails above as sanity checks, then layer qualitative signals—team, timing, distribution—to decide where to place your bets or career. Next step: pick two sectors from this list, run the seven-step analysis, and score them against your resources and goals.
FAQs
1) What makes a sector more likely to generate unicorns?
Sectors with large TAM, high gross margins, and strong network or data effects generate outsized unicorn counts. Add predictable revenue (subscriptions or repeat transactions) and multiple monetization levers (payments, ads, financing), and the path to $1B+ valuations accelerates. The opposite—narrow TAM, low margins, and weak distribution—suppresses unicorn formation even if a sector is trendy.
2) Are unicorn counts reliable across data sources?
Different trackers use slightly different taxonomies and inclusion rules (active vs. exited, currency, methodology). Treat counts directionally and check multiple sources. If two reputable trackers both show fintech and enterprise software near the top, the relative ranking is likely robust even if totals differ.
3) Why do some sectors have lower margins yet still create unicorns?
Network effects and volume can trump margin. Marketplaces often run at lower gross margins but command scale advantages (liquidity, selection, trust) and layer higher-margin services (ads, logistics, financing). When contribution margins and retention are healthy, valuation can still compound quickly.
4) How do regulations change the unicorn calculus?
Regulation can raise the floor and ceiling. In fintech and healthcare, compliance is costly but creates barriers to entry. Companies that pass audits, integrate with legacy infrastructure, and maintain strong governance can grow faster once scaled, helping them join the unicorn cohort.
5) What’s the biggest mistake teams make when chasing unicorn status?
Over-indexing on topline growth while ignoring unit economics and cash conversion. If CAC payback stretches too long or variable costs creep up, growth becomes fragile. The remedy is ruthless cohort tracking, pricing discipline, and sequencing expansion only after core unit economics prove resilient.
6) Does geography matter for sector leadership?
Yes, but mostly by go-to-market mechanics. Fintech and SaaS lead in many regions, yet sub-sectors vary with local regulation, payments rails, and talent pools. For example, logistics and marketplaces may surge in regions with fragmented retail supply chains, while AI infra clusters near compute and research hubs. Cross-check a sector’s regional density in multiple trackers.
7) How do I compare sectors if my product spans multiple categories?
Create a revenue mix view (e.g., 60% SaaS, 40% payments). Evaluate each stream’s margins, churn, risk, and growth, then weight the sector guardrails accordingly. Investors will value you on the blended profile, so shore up the weakest stream or re-segment your narrative to highlight the healthiest engine.
8) Are AI unicorns a bubble?
AI has real utility curves (better models, cheaper inference) and massive adoption. But cost control and defensibility matter: proprietary data, distribution, or specialized models often separate durable unicorns from those riding hype. Lean teams can reach scale quickly, but retention and margins must hold as competition intensifies. Business Insider
9) What exit paths support unicorn valuations?
Two main tracks: IPO for stand-alone brands with durable growth/margins, and strategic M&A for companies that fill gaps in larger platforms (security, data tools, vertical SaaS). A rich history of both paths in the sectors above underpins investor willingness to award unicorn valuations, visible in deal and exit sections of major databases.
10) How should I use sector benchmarks without misleading myself?
Benchmarks are guardrails, not goals. Use them to flag anomalies—CAC payback too long, margins too low, retention too weak. Then dig into why (pricing, segment mix, product gaps). If your economics improve cohort by cohort, you can still become a category outlier.
References
- The Complete List of Unicorn Companies, CB Insights — Publication date: not stated. https://www.cbinsights.com/research-unicorn-companies
- Unicorns: Leading Industries & Guides, Dealroom — Publication date: not stated. https://dealroom.co/guides/unicorns
- Unicorns — Global Tracker & Articles, PitchBook — Publication date: not stated. https://pitchbook.com/tag/unicorns
- Unicorn Tracker, CB Insights — Publication date: not stated. https://www.cbinsights.com/research/unicorn-tracker/
- Crunchbase Unicorn Board (Methodology and Updates), Crunchbase News — Publication date: not stated. https://news.crunchbase.com/venture/unicorn-board-count-soars-september-2025-nscale-filevine/
- Unicorns and $1B+ Exits, Dealroom Database — Publication date: not stated. https://app.dealroom.co/unicorns
- Unicorn Company List & Emerging Unicorns, Crunchbase — Publication date: not stated. https://news.crunchbase.com/unicorn-company-list/
- Global Unicorn Tracker Overview, Tracxn — Publication date: not stated. https://tracxn.com/d/unicorns/unicorn-tracker