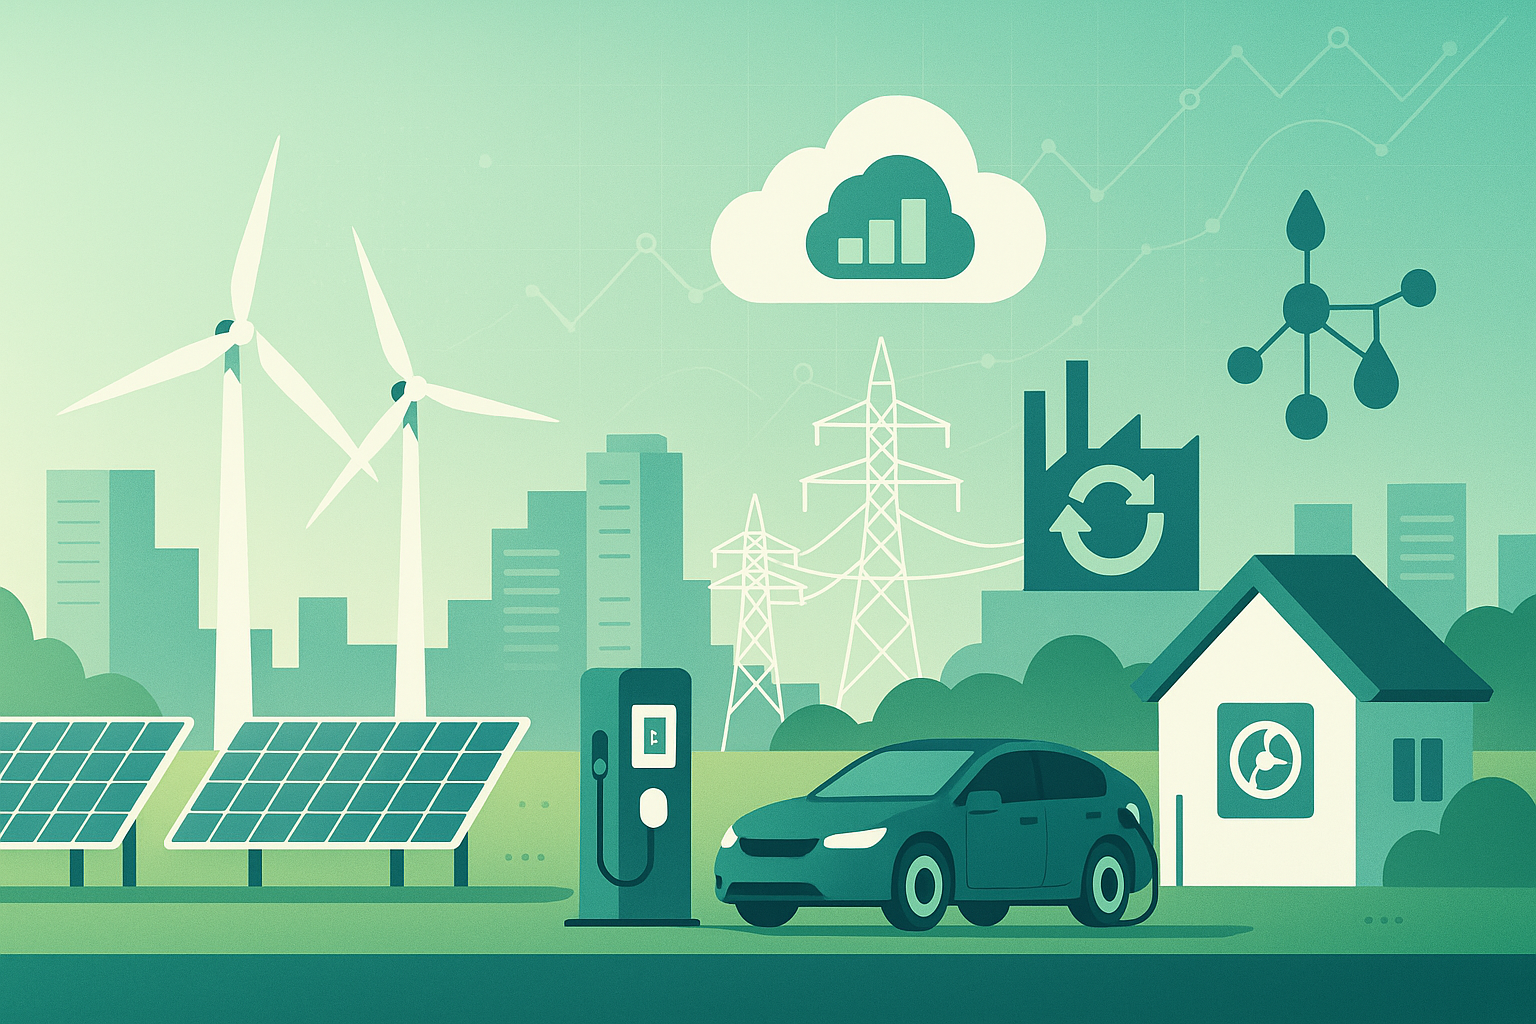
In every sector—from energy to food, buildings to finance—technology is turning sustainability from an aspiration into a set of repeatable, measurable practices. In the next 15 minutes, you’ll learn how digital tools, advanced hardware, and smarter systems are making low-carbon choices cheaper, easier, and more reliable at scale. This guide is written for sustainability leads, founders, policymakers, and curious operators who want step-by-step ways to implement the most impactful tech—today. You’ll find practical requirements, beginner-friendly instructions, KPIs to track, caveats to avoid, and a four-week starter plan you can lift and use.
Key takeaways
- Electrify and digitize first: Clean power plus data visibility unlock the fastest emissions cuts and cost savings.
- Start with “measure to manage”: Sensors, meters, and software create baselines, KPIs, and accountability.
- Design for flexibility: Storage, demand response, and smart charging make clean energy reliable.
- Scale circularity with traceability: Digital product passports and advanced tracking enable reuse and recycling at volume.
- Mind the load growth: AI and electrification drive electricity demand—pair efficiency with expansion.
- Small wins compound: Pilot in one site or SKU, iterate monthly, and roll out with automation.
1) Clean Electricity at Scale: Solar, Wind, and Storage
What it is & why it matters
Clean electricity has become the backbone of sustainable operations. Solar and wind are now the cheapest new bulk power in many regions, and modern battery storage turns variable generation into dependable supply. Together, they reduce exposure to fossil fuel price swings, cut Scope 2 emissions, and unlock electrification across transport, heat, and industry.
Requirements / prerequisites
- Equipment: Rooftop or ground-mount PV, on-site wind (where viable), inverters, smart meters, battery energy storage system (BESS).
- Site needs: Structural roof assessment, interconnection study, and space for inverters/batteries; local permitting.
- Budget: CAPEX varies by size; power-purchase agreements (PPAs) or energy-as-a-service can reduce upfront costs.
- Low-cost alternative: Start with community solar, green tariffs, or a small pilot PV array plus a modest BESS to cover peak hours.
Beginner steps
- Baseline & feasibility: Pull 12–24 months of utility bills; profile load by hour if possible. Run a solar + storage feasibility analysis (many installers provide this free).
- Procure smart meters/CTs: Install revenue-grade meters and set up interval data logging.
- Start with a pilot: 50–200 kW rooftop PV + 1–2 hours of battery duration to shave late-afternoon peaks.
- Layer controls: Add a simple energy management system (EMS) to prioritize battery discharge during peak price windows.
- Contract smartly: If on PPAs, include performance guarantees and clear O&M terms.
Modifications & progressions
- Longer duration storage for evening peaks or backup.
- Add EV chargers and coordinate charge windows with PV output.
- Portfolio PPAs or virtual PPAs when on-site capacity is limited.
Frequency / KPIs
- Monthly: kWh generated; self-consumption rate; peak reduction (kW); battery throughput cycles.
- Quarterly: Dollar savings vs. baseline; avoided tCO₂e (market-based Scope 2); equipment availability (%).
- Annually: Degradation trends, inverter efficiency, O&M cost per kW.
Safety, caveats, mistakes
- Interconnection delays are common—begin early.
- Over-sizing batteries without a tariff-aware dispatch strategy reduces ROI.
- Rooftop loading: Always get a structural assessment.
Mini-plan (example)
- Week 1: Metering, load profile, tariff analysis.
- Week 2–3: Feasibility, RFP, select EPC.
- Week 4: Sign EPC/PPA; schedule interconnection studies.
2) Smarter, Flexible Grids: Demand Response, VPPs, and Smart Meters
What it is & why it matters
Smart meters, connected devices, and software turn buildings and equipment into flexible grid assets. Demand response (DR) and virtual power plants (VPPs) shift or shed load at peak times—cutting bills, preventing blackouts, and enabling higher shares of wind and solar.
Requirements / prerequisites
- Equipment: Smart meters/AMI, controllable loads (HVAC, heat pumps, water heaters, refrigeration, EV chargers), a DR/VPP platform.
- Tariff: Time-of-use (TOU) or real-time pricing improves savings; enroll in local DR programs if available.
- Low-cost alternative: Begin with manual load shifting using simple scheduling rules.
Beginner steps
- Inventory controllable loads and map their flexibility windows (e.g., HVAC pre-cooling 2–3 hours before peak).
- Enroll in DR/VPP via utility or aggregator; connect meters and device controllers.
- Set automation rules: Pre-heat/Pre-cool, staggered EV charging, refrigeration defrost cycles off-peak.
- Test “event days” with conservative setpoints; monitor comfort/quality.
- Refine response curves to maximize $/kW without hurting operations.
Modifications & progressions
- Integrate battery storage for deeper peak shaving.
- Expand to multi-site orchestration with centralized control.
- Add predictive controls based on weather and occupancy.
Frequency / KPIs
- Per event: kW reduced vs. baseline, rebate earned.
- Monthly: Peak demand (kW), demand charges, comfort/quality incidents.
- Annually: DR earnings; avoided outages; customer/tenant satisfaction.
Safety, caveats, mistakes
- Avoid over-curtailing critical loads; define “no-go” circuits.
- Ensure fallback modes if communications fail.
- Document occupant comfort policies.
Mini-plan (example)
- Step 1: Enroll in a DR program, connect HVAC and EVSE.
- Step 2: Create a 3-hour pre-cooling schedule on summer peak days.
- Step 3: Review savings; tighten setpoints gradually.
3) Electrified Transport: EVs, Smart Charging, and Fleet Optimization
What it is & why it matters
Electric vehicles cut tailpipe emissions and, when charged smartly, can lower total cost of ownership. For fleets, route optimization and telematics compound savings, while smart charging aligns with cheap, clean power.
Requirements / prerequisites
- Vehicles: EV models that meet duty cycles (range, payload).
- Charging: Level 2 for depots/offices; DC fast for high-throughput routes.
- Software: Telematics, route planning, and a charge management system.
- Low-cost alternative: Start with pool cars or a single pilot route.
Beginner steps
- Duty cycle analysis: Daily mileage, dwell times, idle windows.
- Pick one pilot vehicle and two Level 2 chargers; set TOU charging.
- Train drivers on eco-driving and charge etiquette.
- Monitor TCO (fuel + maintenance) monthly; expand to suitable routes.
Modifications & progressions
- Add DC fast charging for quick turnarounds; explore vehicle-to-building (V2B) pilots where allowed.
- Roll into a VPP for grid services income.
Frequency / KPIs
- Weekly: State of charge (SOC) compliance; driver feedback.
- Monthly: Fuel/maintenance savings; tCO₂e avoided; charger utilization.
- Quarterly: Range sufficiency vs. duty cycles; uptime.
Safety, caveats, mistakes
- Underestimating charging dwell times or grid capacity at depots; coordinate early with the utility.
- Battery health: avoid frequent 100% fast charges unless duty cycle demands it.
Mini-plan (example)
- Step 1: Convert mailroom runs to a compact EV.
- Step 2: Install two Level 2 chargers; set TOU windows.
- Step 3: Scale to three more routes after 60 days of data.
4) Low-Carbon Buildings: Heat Pumps, Automation, and Digital Twins
What it is & why it matters
Buildings drive a large share of global energy demand and emissions. Heat pumps deliver efficient heating and cooling; building automation squeezes waste; digital twins (data-rich virtual models) optimize retrofits and operations.
Requirements / prerequisites
- Equipment: Heat pumps sized to climate; upgraded electrical panel (if needed); smart thermostats; occupancy and CO₂ sensors; sub-metering.
- Software: BMS/EMS platform; optional 3D scan/BIM data for a digital twin.
- Low-cost alternative: Start with smart thermostats and weather-responsive schedules.
Beginner steps
- Audit loads: HVAC, lighting, plug loads; identify biggest end-uses.
- Quick wins: LED retrofits; weatherization (sealing, insulation); optimize setpoints.
- Pilot a heat pump in one zone or small building; monitor comfort and bills.
- Automate: Occupancy-based ventilation; demand-controlled ventilation (DCV) by CO₂.
- Create a simple twin: Layer floor plans, meter data, and HVAC controls to test schedules before deploying.
Modifications & progressions
- Hydronic or ground-source heat pumps in cold climates.
- Thermal storage (ice or water tanks) for load shifting.
- Continuous commissioning with anomaly detection.
Frequency / KPIs
- Monthly: Heating/cooling kWh per m²; HVAC runtime; comfort complaints.
- Quarterly: EUI (kWh/m²/year), peak kW, maintenance calls.
- Annually: Retrofit ROI, avoided tCO₂e, ENERGY STAR-like score where available.
Safety, caveats, mistakes
- Sizing errors—use detailed load calcs, not rules of thumb.
- Ventilation mis-tuning can cause IAQ issues; monitor CO₂ and humidity.
- Budget panel upgrades if moving multiple end-uses to electric.
Mini-plan (example)
- Step 1: Sub-meter HVAC and lighting; install smart thermostats.
- Step 2: Replace one gas RTU with a heat pump; tune schedules.
- Step 3: Scale to additional zones after a season of data.
5) Precision Agriculture: Sensors, AI, and Water-Wise Irrigation
What it is & why it matters
Precision ag uses satellites, drones, soil moisture probes, weather data, and AI to optimize inputs—water, fertilizer, pesticides—and improve yields while cutting runoff and emissions. Smart irrigation alone can dramatically reduce water use.
Requirements / prerequisites
- Equipment: Soil moisture sensors, flow meters, variable-rate controllers, weather stations.
- Data: Satellite imagery (NDVI), drone surveys (optional), farm management software.
- Low-cost alternative: Start with soil tensiometers and irrigation scheduling apps.
Beginner steps
- Map zones: Identify fields with over-watering or low yields.
- Install moisture sensors and flow meters on one or two pivots/blocks.
- Set rules: Water only when soil tension crosses threshold; skip after rainfall.
- Trial variable-rate application based on NDVI zones.
- Measure: Compare water, fertilizer, and yields vs. historical averages.
Modifications & progressions
- Add drip irrigation where feasible; integrate fertigation.
- Deploy drone scouting for early pest detection.
Frequency / KPIs
- Weekly: Soil moisture trends; irrigation runtime; mm of water applied.
- Per season: Yield per hectare; fertilizer rate per hectare; runoff events; tCO₂e from inputs.
Safety, caveats, mistakes
- Sensor placement matters: avoid gravel pockets or atypical soil areas.
- Over-trusting NDVI without ground truth can mislead; keep field notes.
Mini-plan (example)
- Step 1: Place sensors at two depths in three representative zones.
- Step 2: Adjust schedules to maintain optimal root-zone moisture.
- Step 3: Variable-rate nitrogen on next application; review yields at harvest.
6) Water Management: Leak Detection, Smart Meters, and Non-Revenue Water
What it is & why it matters
Cities and campuses lose significant water to leaks and metering gaps—non-revenue water is often around a third of supply in many systems. Smart meters, acoustic loggers, and analytics reduce waste, energy for pumping, and water bills.
Requirements / prerequisites
- Equipment: Ultrasonic water meters, pressure sensors, acoustic leak loggers, data platform.
- Low-cost alternative: Start with district metering areas (DMAs) and night-flow analysis without full smart meter rollout.
Beginner steps
- Create DMAs: Segment the network for measurement; baseline night-time minimum flow.
- Install loggers in the highest-loss DMA; walk-by or permanent.
- Fix prioritized leaks using a simple cost-per-m³-saved ranking.
- Replace stuck meters and right-size oversized ones.
- Expand to customer-side leaks: Offer alerts and rebates.
Modifications & progressions
- Pressure management and smart valves to cut burst frequency.
- Advanced analytics combining pressure transients and flow anomalies.
Frequency / KPIs
- Monthly: Non-revenue water (%), leak repair time (days), minimum night flow (m³/h).
- Quarterly: Energy per m³ pumped, pipe burst incidents.
- Annually: Water saved, $ saved, tCO₂e avoided (from reduced pumping).
Safety, caveats, mistakes
- Inaccurate baselines (faulty meters) skew savings.
- Over-pressurization can cause new leaks—verify valve setpoints.
Mini-plan (example)
- Step 1: Establish DMAs and baselines.
- Step 2: Instrument worst DMA; repair top three leaks.
- Step 3: Roll program to next two DMAs.
7) Circularity at Scale: Digital Product Passports and Traceability
What it is & why it matters
To move from linear “take-make-waste” to circular flows, businesses need traceable data—materials, repairability, recycled content, and end-of-life options. Digital Product Passports (DPPs) store standardized lifecycle data per product, enabling repair, reuse, and high-quality recycling, and helping teams comply with emerging regulations.
Requirements / prerequisites
- Data model: Bill of materials, material origins, recycled content, repair manuals, certifications.
- Tech: Unique identifiers (QR/NFC/RFID), cloud data store, access controls.
- Low-cost alternative: Pilot a single SKU with a QR linking to a simple product file and repair guide.
Beginner steps
- Choose a pilot category (e.g., electronics or apparel).
- Define the data schema (core attributes + repair info).
- Apply unique IDs and stand up a basic portal with role-based access.
- Collect reverse-logistics data (returns, refurb outcomes).
- Close the loop: Market refurbished SKUs; issue recycled-content claims with evidence.
Modifications & progressions
- Interoperate with suppliers’ systems via APIs.
- Link passports to take-back incentives and warranty extensions.
Frequency / KPIs
- Monthly: % SKUs with DPP, repair turnaround, refurb yield.
- Quarterly: Recycled content share, take-back rate, landfill diversion.
- Annually: Circular revenue, avoided virgin material (kg), tCO₂e avoided.
Safety, caveats, mistakes
- Data integrity is critical; audit suppliers.
- Privacy/commercial sensitivity: Use tiered access; don’t expose trade secrets.
Mini-plan (example)
- Step 1: Map the product data fields and owners.
- Step 2: Tag 1,000 pilot units; publish DPP pages.
- Step 3: Launch a repair/refurb program with KPIs.
8) Cleaner Materials and Industrial Process Innovation
What it is & why it matters
Heavy materials (cement, steel) and process heat drive a large slice of emissions. Technologies like lower-clinker cements (e.g., calcined-clay blends), electric arc furnaces for steel with high scrap input, electrified process heat, and advanced kiln and furnace controls cut embodied carbon while maintaining performance.
Requirements / prerequisites
- Procurement power: Include Environmental Product Declarations (EPDs) and embodied-carbon thresholds in bids.
- Process data: Meter thermal loads; log batch quality.
- Low-cost alternative: Start with spec changes (e.g., blended cement, higher recycled content steel) before capex-heavy upgrades.
Beginner steps
- Measure embodied carbon using EPDs across top materials.
- Change specs to allow lower-carbon cement blends and high-recycled steel.
- Tune burners/kilns with sensors; add heat recovery where possible.
- Pilot electrified heat for lower-temperature processes.
- Track quality and rejects to ensure performance holds.
Modifications & progressions
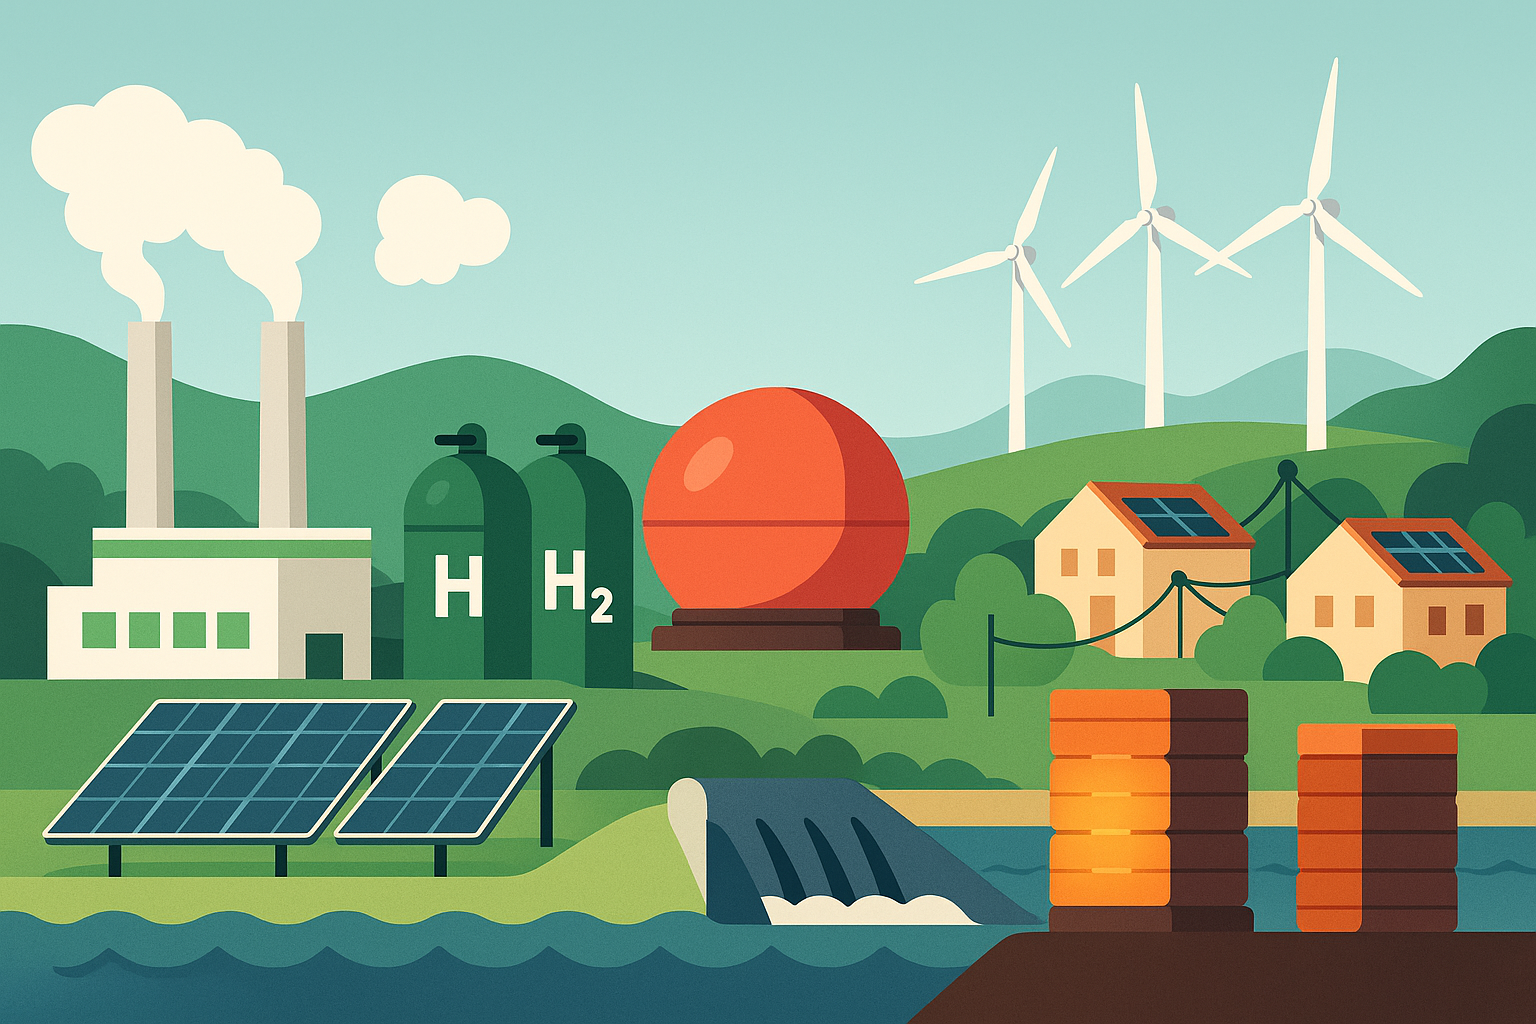
- Onsite renewables + storage to decarbonize electricity used in EAFs and electric boilers.
- Explore green hydrogen for high-temperature needs where economics align.
Frequency / KPIs
- Per batch: Quality metrics vs. baseline.
- Monthly: kgCO₂e per tonne of product; energy intensity (kWh/tonne).
- Quarterly: Scrap rate; maintenance downtime.
Safety, caveats, mistakes
- Spec risk: Involve structural engineers for cement and steel substitutions.
- Power quality: Electrified processes may need harmonic filtering and grid upgrades.
Mini-plan (example)
- Step 1: Require EPDs in RFQs for top five materials.
- Step 2: Approve two lower-carbon alternates; run parallel trials.
- Step 3: Scale plant-wide after sign-off.
9) Data Centers and Cloud Efficiency: Doing More with Less Energy
What it is & why it matters
Digital infrastructure underpins modern business—and electricity demand is rising fast with AI adoption. Efficiency measures (right-sizing, advanced cooling, workload scheduling) plus clean power procurement keep growth compatible with sustainability targets.
Requirements / prerequisites
- Visibility: Power usage effectiveness (PUE), server utilization, and cooling metrics.
- Tech: Liquid cooling (where appropriate), hot/cold aisle containment, free cooling, AI-assisted workload orchestration.
- Low-cost alternative: Start by decommissioning idle servers and raising data-hall temperatures within ASHRAE ranges.
Beginner steps
- Audit assets for “comatose” servers and underutilized VMs.
- Raise setpoints (e.g., from 20°C to 24–27°C where allowed); tighten containment.
- Optimize workloads to off-peak hours; schedule energy-intensive AI training where electricity is cheaper/cleaner.
- Green power via PPAs or on-site solar; match supply to load growth.
- Track PUE and water usage effectiveness (WUE) monthly.
Modifications & progressions
- Liquid cooling for dense racks; AI-based cooling control.
- Adopt 24/7 carbon-free energy (CFE) procurement targets.
Frequency / KPIs
- Monthly: PUE, WUE, server utilization, carbon intensity (gCO₂e/kWh).
- Quarterly: % workloads on low-carbon hours; data-hall temperature compliance.
- Annually: tCO₂e from ops; $/compute-hour.
Safety, caveats, mistakes
- Don’t compromise hardware warranties with out-of-spec cooling strategies.
- Grid constraints: Coordinate interconnection capacity early for expansions.
Mini-plan (example)
- Step 1: Decommission comatose servers; reclaim IPs.
- Step 2: Implement containment and raise setpoints by 1–2°C.
- Step 3: Shift nightly batch and model training to low-carbon windows.
10) Digital Carbon Accounting and MRV: From Guesswork to Confidence
What it is & why it matters
You can’t manage what you don’t measure. Carbon accounting platforms following established standards, paired with digital measurement, reporting, and verification (MRV), give leaders defensible inventories, traceable reductions, and investor-grade disclosures.
Requirements / prerequisites
- Data sources: Utility bills, fuel receipts, procurement spend, travel data, logistics, and supplier disclosures.
- Frameworks: Adopt a recognized accounting standard and set governance for data quality.
- Low-cost alternative: Start with Scopes 1–2 and the top five Scope 3 categories by spend.
Beginner steps
- Map data owners across finance, operations, procurement.
- Stand up a single system of record; automate data ingestion where possible.
- Prioritize material categories: Focus on largest emissions first.
- Embed approvals and audit trails; export reports on a fixed cadence.
- Tie to action: Link KPIs (kWh, fuel, ton-km) to projects (efficiency, mode shift, supplier engagement).
Modifications & progressions
- Supplier data programs (primary data collection) and contractual clauses for EPDs and emissions reporting.
- Integrate remote sensing (e.g., methane, deforestation alerts) as digital evidence in MRV.
Frequency / KPIs
- Monthly: % automated data feeds; exception rates; coverage of emissions by primary data.
- Quarterly: Progress to target (absolute and intensity); audit findings closed.
- Annually: Assurance outcome; stakeholder disclosure timelines met.
Safety, caveats, mistakes
- Double counting across scopes and suppliers—document boundaries.
- Over-precision on low-material categories—focus efforts where impact is greatest.
Mini-plan (example)
- Step 1: Create a data inventory and RACI.
- Step 2: Automate utility and fleet data feeds.
- Step 3: Publish Q1 baseline; launch top-3 reduction projects linked to KPIs.
Quick-Start Checklist
- Pull 12–24 months of energy and fuel bills; enable interval metering.
- Identify one clean power + storage pilot at a priority site.
- Enroll in demand response or configure a basic load-shifting schedule.
- Select one fleet route for EV pilot; install two Level 2 chargers.
- Choose one building zone for a heat-pump pilot; install smart thermostats.
- Instrument water flows in a pilot DMA; fix the top three leaks.
- Pick one product/SKU for a Digital Product Passport pilot.
- Stand up a carbon data hub; automate two high-quality data feeds.
Troubleshooting & Common Pitfalls
- “We installed tech but don’t see savings.” Check metering baseline, control logic (are schedules actually applied?), and tariff alignment (are peaks targeted?).
- “Our DR events upset occupants.” Tighten comfort bands slowly; communicate event windows; exclude sensitive zones.
- “EVs cause demand spikes.” Stagger charging; set SOC targets; add a small buffer battery or V2B where allowed.
- “Water leaks keep returning.” Add pressure management; review transient events; maintain valve setpoints.
- “Suppliers won’t share data.” Use phased requirements in contracts; offer templates; start with the top-spend vendors.
- “Too many dashboards.” Consolidate KPIs into a single weekly view; automate alerts for exceptions only.
- “Project delays.” Begin interconnection, permitting, and IT security reviews early; pre-qualify vendors.
How to Measure Progress (and Prove It)
Core KPI families
- Energy: kWh, kW peaks, on-site generation, battery throughput, PUE/WUE.
- Emissions: Market-based Scope 2 (location as a cross-check), Scope 1 fuels, top Scope 3 categories.
- Water: Non-revenue water %, minimum night flow, leak repair time.
- Circularity: % SKUs with DPP, repair/return rates, recycled content share.
- Financials: Net present value (NPV), simple payback, DR/VPP earnings, tariff savings.
- Reliability/comfort: Equipment availability, occupant complaints, quality rejects.
Evidence & assurance tips
- Keep meter-level exports and system logs.
- Snapshot configurations when deploying new controls.
- Maintain vendor performance guarantees and test reports.
- Use third-party assurance for inventories and embodied-carbon claims where material.
A Simple 4-Week Starter Plan
Week 1: Instrument & Baseline
- Activate interval metering for power and key water lines.
- Stand up a carbon data workbook; define Scope boundaries.
- Select pilot sites for PV + storage, DR, EVs, and one building zone for a heat-pump trial.
Week 2: Pilot Configuration
- Issue an RFP for a modest PV + BESS pilot; request performance guarantees.
- Enroll in a DR program; configure HVAC pre-cooling rules.
- Install two Level 2 EV chargers; set TOU schedules.
- Install smart thermostats and CO₂ sensors; define comfort bands.
Week 3: Circularity & Water
- Define DPP schema for one SKU; print QR/NFC tags.
- Segment one water DMA; deploy leak loggers; schedule repairs for top three leaks.
- Train staff on dashboards and escalation paths.
Week 4: Launch & Review
- Execute a DR test event; verify savings and comfort.
- Begin EV pilot route; track TCO savings weekly.
- Publish a one-page KPI dashboard and a 90-day rollout plan.
FAQs
1) Where should we start if we have limited budget?
Pick one site and one initiative with fast payback: DR/load shifting or a small PV + battery pilot. Pair it with interval metering so savings are visible and defensible.
2) How do we avoid greenwashing when we buy clean power?
Use metered on-site generation where possible and ensure renewable contracts have additionality and hourly/seasonal alignment where feasible. Track market-based and location-based emissions in parallel.
3) Are heat pumps viable in cold climates?
Yes—modern cold-climate units perform well below freezing. Proper sizing, weatherization, and backup strategies (e.g., resistance or existing systems) maintain comfort during extremes.
4) How do we keep EV charging from spiking demand charges?
Use smart charging to cap site demand, schedule off-peak charging, and consider a small on-site battery to buffer fast-charge sessions.
5) What if our suppliers won’t share lifecycle data for digital product passports?
Begin with top-spend vendors, provide templates, and phase requirements into contracts. Start with critical attributes (composition, recycled content, repair instructions).
6) Our data center’s PUE is already “good.” What else can we do?
Decommission zombie servers, raise temperature setpoints within safe ranges, explore liquid cooling for dense racks, and procure clean power with temporal matching.
7) How do we measure water program ROI?
Track non-revenue water percentage, minimum night flow, and repair times. Convert m³ saved to avoided pumping energy and water purchase costs.
8) Is satellite monitoring really useful for sustainability teams?
Yes—deforestation alerts, methane plume detection, and land-use change signals feed supply-chain due diligence, compliance, and project MRV, especially when paired with ground validation.
9) Do we need third-party assurance on our emissions inventory?
For investor-grade reporting and major targets, yes. At a minimum, have clear data governance, audit trails, and change logs; then pursue limited or reasonable assurance as materiality grows.
10) What’s the biggest mistake teams make?
Jumping to hardware without metering and controls. Always start with measurement and automation—then scale capital projects with confidence.
Conclusion
Technology has shifted sustainability from slogans to systems. With smart metering and controls, clean power plus storage, electrified transport, intelligent buildings, and traceable, circular supply chains, any organization can cut emissions and costs simultaneously. The playbook is repeatable: measure, automate, electrify, and verify—then scale what works across sites, products, and partners.
Call to action: Pick one pilot from this guide, set three KPIs, and launch it this month.
References
- Global EV Outlook 2025, International Energy Agency, 2025. https://www.iea.org/reports/global-ev-outlook-2025
- Renewable Power Generation Costs in 2022, International Renewable Energy Agency, 2023. https://www.connaissancedesenergies.org/sites/connaissancedesenergies.org/files/pdf-pt-vue/IRENA_Renewable_power_generation_costs_in_2022.pdf
- Renewable Power Generation Costs in 2023 (Summary), International Renewable Energy Agency, 2024. https://www.windenergy.org.nz/wp-content/uploads/2024/08/IRENA_Renewable_power_generation_costs_in_2022_SUMMARY.pdf
- Electricity 2024 – Executive Summary, International Energy Agency, January 19, 2024. https://www.iea.org/reports/electricity-2024/executive-summary
- Electricity 2024 – Analysis and Forecast to 2026 (PDF), International Energy Agency, January 19, 2024. https://iea.blob.core.windows.net/assets/6b2fd954-2017-408e-bf08-952fdd62118a/Electricity2024-Analysisandforecastto2026.pdf
- Data Centres and Data Transmission Networks – Tracking, International Energy Agency, July 11, 2023. https://www.iea.org/energy-system/buildings/data-centres-and-data-transmission-networks
- Global Electricity Demand to Keep Growing Robustly Through 2026, International Energy Agency (news release), July 30, 2025. https://www.iea.org/news/global-electricity-demand-to-keep-growing-robustly-through-2026-despite-economic-headwinds
- Energy and AI: Energy Demand from AI, International Energy Agency, 2025. https://www.iea.org/reports/energy-and-ai/energy-demand-from-ai
- Global Energy Storage Market Records Biggest Jump Yet, BloombergNEF (insight), April 25, 2024. https://about.bnef.com/insights/clean-energy/global-energy-storage-market-records-biggest-jump-yet/
- Global Energy Storage Growth Upheld by New Markets, BloombergNEF (insight), June 18, 2025. https://about.bnef.com/insights/clean-energy/global-energy-storage-growth-upheld-by-new-markets/
- Solar, Battery Storage to Lead New U.S. Generating Capacity Additions in 2025, U.S. Energy Information Administration (Today in Energy), February 24, 2025. https://www.eia.gov/todayinenergy/detail.php
- Global Status Report for Buildings and Construction, UN Environment Programme/GlobalABC, March 7, 2024. https://www.unep.org/resources/report/global-status-report-buildings-and-construction
- Global Status Report for Buildings and Construction 2024/25 (PDF), GlobalABC, March 1, 2025. https://globalabc.org/sites/default/files/2025-03/Global-Status-Report-2024_2025.pdf
- Digitalisation – Enabler of Decarbonisation, International Energy Agency, 2023–2024 updates. https://www.iea.org/energy-system/decarbonisation-enablers/digitalisation
- Virtual Power Plants – Pathways to Commercial Liftoff (PDF), U.S. Department of Energy, October 2023. https://liftoff.energy.gov/wp-content/uploads/2023/10/LIFTOFF_DOE_VVP_10062023_v4.pdf


1 Comment